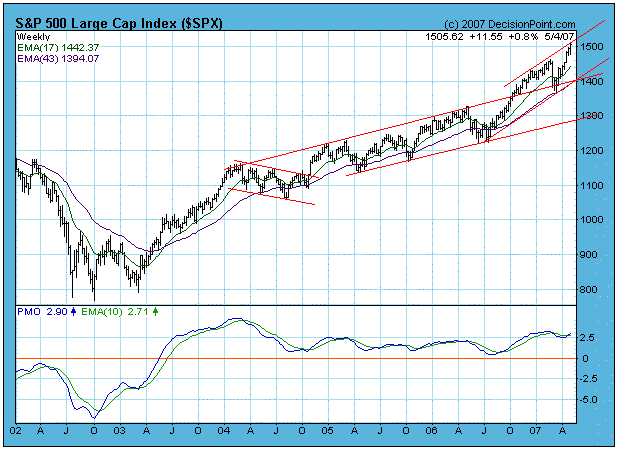
The weekly chart of the S&P 500 Index below reveal that prices are behaving in a very bullish fashion. The index has broken above the gradually rising trend channel that prevailed from 2004. In March prices pulled back and successfully tested the support provided by the top of the channel. Since then the rally resumed, making new highs and apparently establishing an even steeper rising trend channel.
Because prices have reached the top of the channel, we must consider that the market is overbought, and there are plenty of other indicators that will confirm this; however, there is no technical justification to turn bearish at this time. It is possible for prices to continue to rise just below the top of the channel, or another correction may take place, taking prices back to the bottom of the channel. Worse could happen, but I do not expect it.
Bottom Line: Overbought conditions in bull markets may cause more caution than usual, but higher prices can occur, even as the overbought condition corrects.


