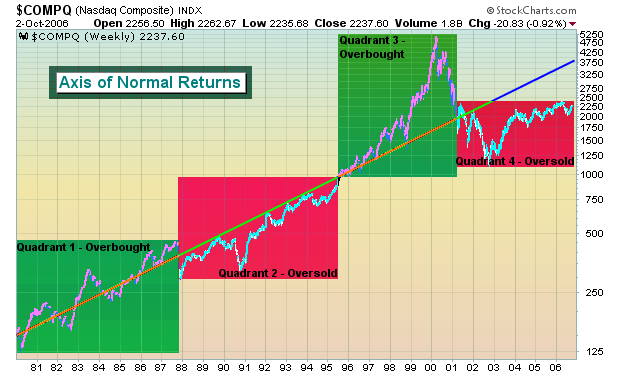
Folks, we're merely in the second or third inning of a nine inning game. Let there be no doubt, the bulls are in charge. And they will remain in charge. This current bull rally goes beyond interest rates, earnings, inflation, blah, blah, blah. It's not that those fundamentals aren't important, they are. But we are talking about supply and demand, Economics 101. We are seeing deal after deal after deal. We have been talking for months at Invested Central about the long-term effect of all of these buyouts and private equity deals. First of all, the fact that these deals are occurring at all should give you a clue about valuations - prices are CHEAP. Did you notice the premium Microsoft was willing to pay for aQuantive? How about 77%? We hear very little about initial public offerings (IPOs) and secondary public offerings. Instead, it's about buyouts, private equity deals, and corporate stock repurchase plans . That equals supply reduction. As supply dwindles, prices rise assuming demand is constant. The best news is that demand hasn't even begun to pick up yet. During the bull market run from 1995-1999, the NASDAQ rose more than 5% in a calendar month 22 different times. There were 22 different calendar months that produced gains of more than 5%. So, on average, the NASDAQ had 4 or 5 of these months each year. Interestingly enough that during the NASDAQ's advance since July 2006 there has not been one calendar month of 5% appreciation. Yet I heard last week talk of another "bubble". Let's get real! The psychology of investors is so tainted since the 2000-2003 NASDAQ crash that they cannot see the forest for the trees. I want to reprint a chart that was posted in a previous newsletter to give you the Big Picture view of what's transpiring in the stock market. I call it the "Axis of Normal Returns" (see chart below). Over short and intermediate terms, the market's pricing efficiency struggles, but over the long term generally gets it right. The Axis of Normal Returns provides a look at the Big Picture.
We anticipate a strengthening economy in the second half of 2007, an accommodating Fed - which we haven't had in several years - and, as a result, expanding multiples. The put call ratio, a contrarian indicator, continues to reflect bearishness or at best guarded optimism. Historically, that has not been a sign of a topping equity market. Rather, it provides the fuel for a further advance. As long as skeptics abound, the market has plenty of upside remaining.