The market periodically finds reasons to selloff, even in bull markets. This past week it was all about interest rates. You could see it coming. Interest rates had been rising for the last month. The yield on the 10 year treasury bond increased from 4.61% on May 8th to a high of 5.18% on Friday, June 8th, before settling back at the close to 5.12%. Equity markets get skittish as interest rates rise, and generally for good reason. When rates rise, access to capital begins to dry up, capital expenditures drop and corporate America sees shrinking profits. Think about what's driven the market for the last year or more - private equity deals, merger mania, and corporate share buybacks. As access to capital becomes more difficult, we see less of what's been driving the market higher.
But is this rise in interest rates temporary or permanent? And what's causing it? The answers to those two questions will directly impact equity prices over the next many months and quite possibly 1-3 years. First, you have to realize that bonds trade the same as stocks and their prices move up and down, rarely do they move in just one direction. Keep in mind also that as bond prices rise, yields drop. Conversely, as bond prices drop, yields rise. That's what we've seen over the past thirty days, a deep selloff in bonds and yields on the rise.
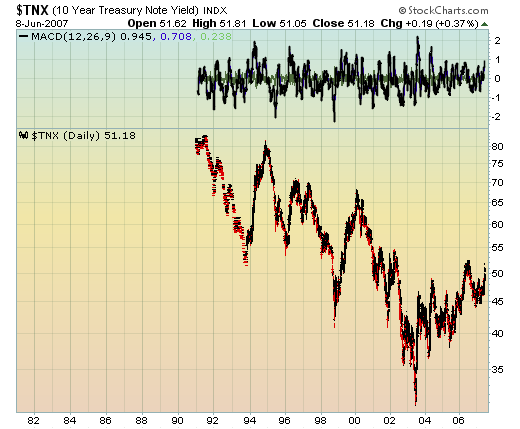
Look at the long-term chart of the yield on the 10 year treasury bond. Because bonds trade like stocks, technical traders follow the same basic principles. Long-term trendlines matter. As you can see from Chart 1 below, the yield on the 10 year treasury bounced off of long-term trendline resistance on Friday.
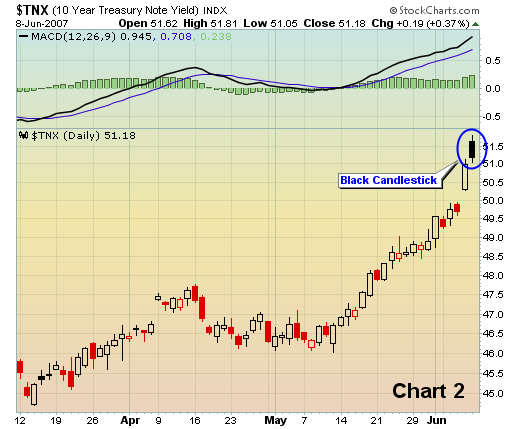
The second chart that we'd like for you to look at is a short term candlestick chart of the yield over the past few months. After a lengthy downtrend in bonds and a corresponding uptrend in yields, we saw the "dreaded" black candle appear at the top of the uptrend - see Chart 2.
If you're looking at the price of the bond, you'll see a red hollow candle appear after a lengthy downtrend. Both are reversal signs. We believe there is a very strong chance yields topped on Friday and began moving lower.
Black candles appearing the way this one did suggests that the heavy selloff in bonds and exhaustive gap down on Friday (and corresponding spike in the yield) is signaling the bottom of ten year bond prices and the top of the yield. The fact that the yield reversal occurred right at long-term resistance gives us more confidence the top has been hit.
We continue to believe that inflation is not a problem in the U.S. When the Fed meets at the end of June, we expect to hear that inflation remains a concern, but that they expect it to moderate throughout the balance of 2007. That news will keep interest rates in check and propel equity prices higher. Of all the scenarios that include higher interest rates, the only one that is terribly troubling is the scenario that shows inflation rising. If interest rates do continue their climb to offset a strengthening economy, we remain steadfastly bullish equity markets. Inflation is the wild card and we are convinced it is a non-event in 2007 and 2008.
Use the recent weakness in the stock market to buy for the longer term. We tend to recognize opportunities after they're over. Take a look now before it's too late.