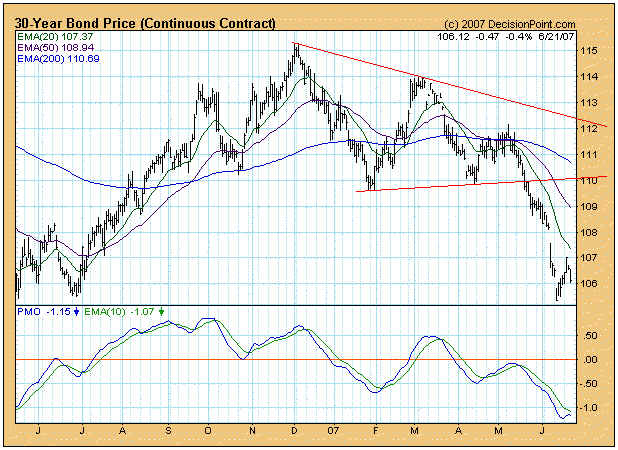
On our first chart, a daily bar chart, we can see that bonds have been weakening for several months, with the most dramatic decline occurring in the last month or so. The question that comes to mind is whether this weakness is a correction in a longer-term up trend or the start of a more serious decline? Since the 50-EMA is below the 200-EMA, we have to assume that bonds have entered a long-term down trend. This situation could change fairly quickly, but for now we need to maintain negative assumptions.
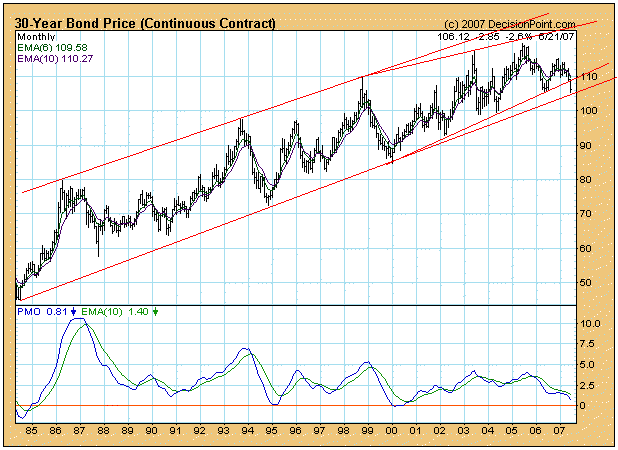
The second chart, a monthly bar chart, helps us put the decline into a very long-term context. Note that bond prices have been within a long-term rising trend channel for over 20 years, and that the recent decline has been stopped (so far) by the long-term rising trend line. This offers some hope that the decline may be over.
On the negative side there is an ascending wedge that has been forming within the rising trend channel. This is a bearish formation, and the technical expectation is for it to resolve to the down side. This month the price index did break down from the wedge, an event that has negative long-term implications.
Bottom Line: My opinion is that bonds are forming a long-term top and are entering a long-term decline. All the signs are negative except that the long-term rising trend remains intact, no small exception that.


