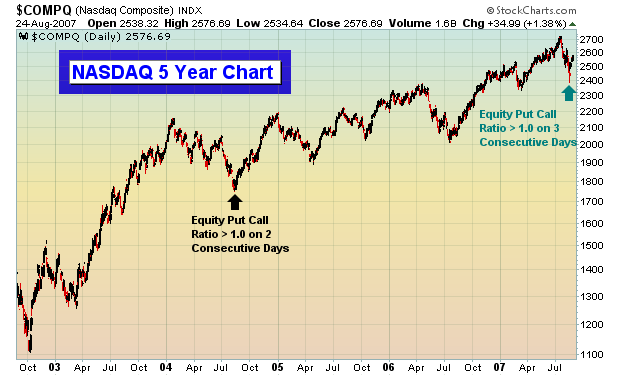
We've discussed in the past the tendency of the market to put in long-term bottoms when the bearish sentiment reaches extreme levels. Extreme bearishness is exactly what we saw on Thursday, August 16. Over the past 4 years or so, we've experienced many occasions when the put call ratio has exceeded 1.0. But there have only been a dozen or so times that the "equity only" put call ratio has topped 1.0. Prior to the recent downtrend, when had seen only one previous occasion where that "equity only" put call ratio topped 1.0 on consecutive days. That occurred in mid-August 2004. On the chart below, you can clearly see that the extreme pessimism seen then marked a long-term bottom, one that was never retested.
Many market pundits are suggesting that we're headed towards disaster given the recent credit crunch. Even that nasty "recession" word is being tossed about. We don't believe a word of it. We look at the current market conditions as a major buying opportunity. Our only question is whether the market can sustain its recent rally as we head into the worst calendar month of the year - September. Major market tops normally coincide with excess bullish sentiment. For instance in 2000 when the major indices began its downward spiral, it was routine to see put call ratios down around .40-.50 - very bullish indeed. Everyone was buying calls because it was "easy money." Margin debt used to buy stocks was at outrageous levels and when the selling began, it fed off itself - a domino effect if you will. We are looking at a market at the opposite end of the sentiment spectrum now. Instead of record margin debt to finance stocks, we see record short interest. Instead of bullish call buyers, we have bearish put buyers. The masses in the options world rarely get it right.
When the Fed begins its interest rate cutting campaign - and the only argument in our minds is when, not if - the stock market will snap back like a stretched rubber band. We've only seen the beginning in the last week. We maintain our very bullish stance on the market with a bias towards the large cap NASDAQ 100 index.