In my August 17 article, Looking For A Retest, I speculated that we would get a bounce from the extreme price lows hit in mid-August, but that a retest of those lows needed to occur before we could be reasonably certain that the completion of a solid bottom had been accomplished. As it happened, the bounce was initiated before I posted the article. At this point I think the evidence suggests that the reaction rally has just about run its course, and that we should be expecting a price top to mark the beginning of a decline into the retest of recent lows.
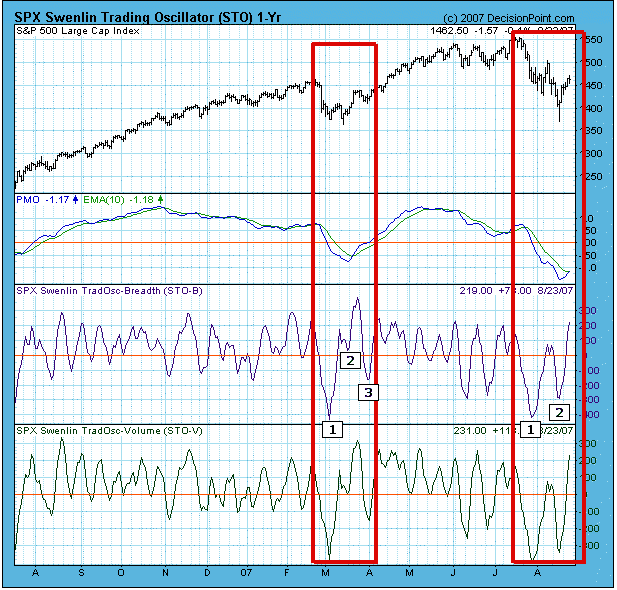
The evidence of which I speak can be seen on the chart below (and on many other short-term indicator charts). There are two versions of the Swenlin Trading Oscillator (STO) – one is calculated from advance-decline breadth (STO-B) and the other from volume (STO-V). On the chart I have outlined two corrective phases – the February/March correction, and the current correction, which, in my opinion, is not yet complete.
Note that there were three separate down thrusts in February/March. The first was into the initial price low, which also registered the lowest of the STO readings. The second was the retest of the first price low, which registered a slightly lower price accompanied by higher STO readings. The third move down was a pullback after a breakout. Note that the breakout was accompanied by very high STO readings, indicating an initial impulse for a new rally, and after that third pullback, the price configuration was clearly bullish.
The current correction has a more bearish slant. The price decline has been more violent, and the second down thrust has led to a much lower price low. The market has rallied out of that low, but you can see that the STO has reached overbought territory, and we should be expecting a short-term top leading to a retest of the correction low. There is no guarantee that the support will hold, so it is no time to be trying to pick a bottom.
Bottom Line: Good arguments are being made by both the bulls and the bears, and the possibilities being presented range from the market being up 22% a year from now to the danger of a 2000 point down day on the Dow. Rather than trying to decide which scenario might materialize, I am comforted by that fact that we are currently 100% neutral in the event the bottom falls out, and I am confident that our primary timing model will pull us into the market in time to catch a good part of any significant up move that occurs.


