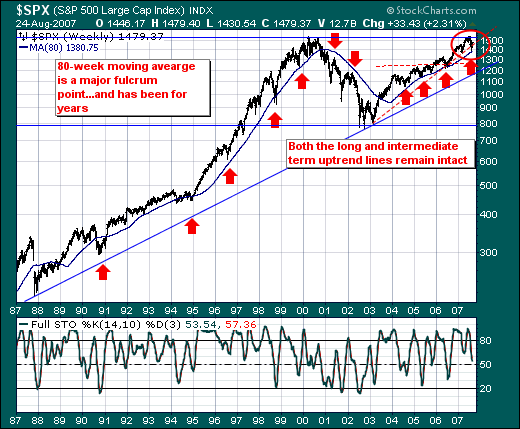
Given the volatility of the capital markets these past two weeks, we think it instructive to step back and take a longer-term viewpoint of the stock market to discern where we may be in the cycle. In doing so, we find the S&P 500 large caps - the strongest relative US average given its international exposure - trading well above its longer-term trendline as well as its 80-week moving average. In the past, this moving average has provided "fulcrum points" between bearish corrections in a bull market and outright bear markets. In the present case, this moving average was successfully tested seven trading sessions prior at 1378, and closed this week out at 1479... a full 100 points above it. Perhaps this simply indicates that a normal -10% correction within a bull market has occurred, and prices have now resumed their upward trend.
That said, the credit contagion seems to be contained for time being; however, the character of the rally hasn't been "strong enough" for us to believe that a "lift-off bottom" is in place. Thus, we are now in the process of layering on short positions for the seasonal September-November swoon back into the 80-week moving average is forthcoming. And if broken - then we would expect to see a bear market decline of -20% and perhaps even more.
As they say: Timing everything.