The market has had a good run since the August lows, but it is challenging all-time highs, and the technical support has been somewhat anemic. With many indicators reaching into overbought territory, and overhead resistance becoming an issue, it looks like a good time for a pullback or consolidation to digest recent gains.
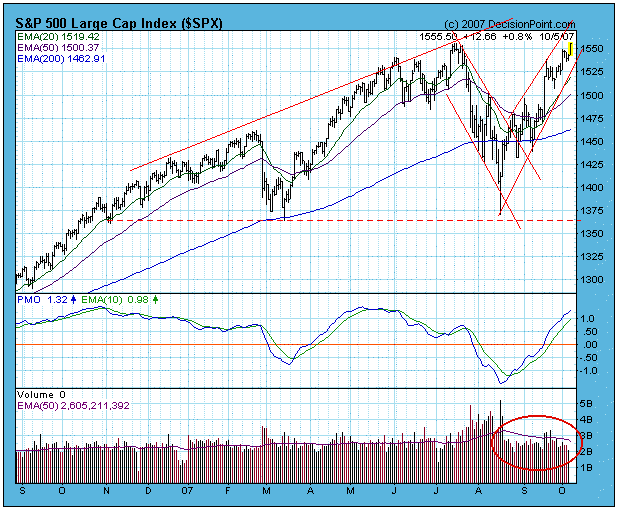
As for technical weakness, the first thing that strikes me is the failure of volume to confirm recent price gains. Note on our first chart that most of the volume bars supporting the recent rally are well below the moving average line.
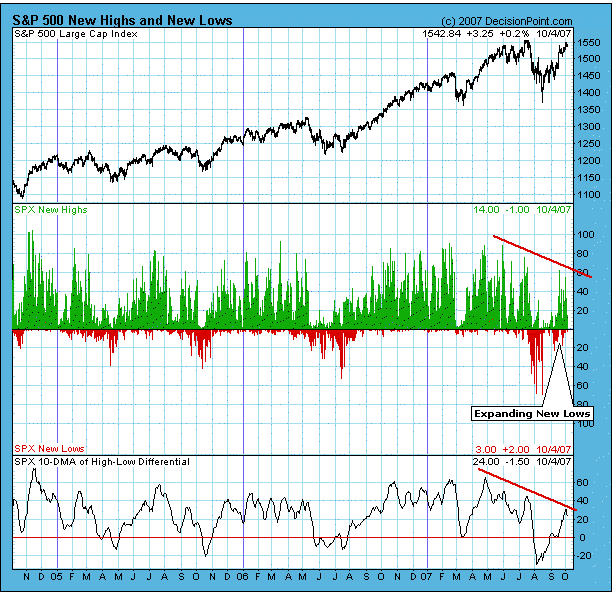
The next chart shows the failure of new 52-week highs to confirm new price highs, and we can observe an uncomfortable level of expanding new lows that accompanied minor pullbacks during the rally.
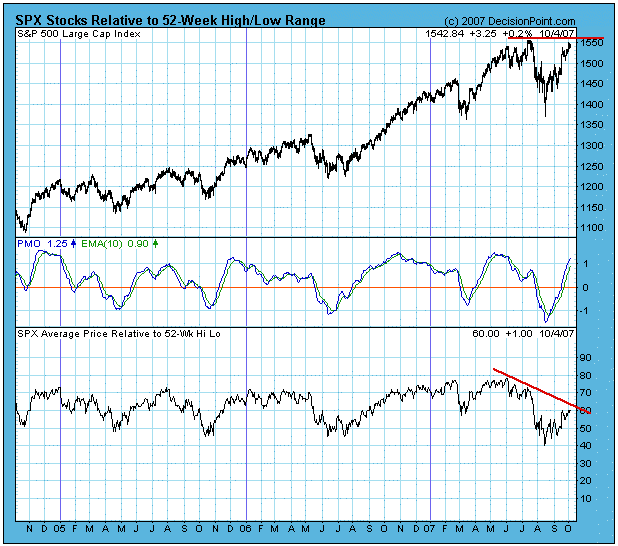
Finally, we have the Rel-to-52 chart, one of our more unusual indicators. The Relative to 52-Week Hi/Lo (Rel to 52) chart tracks each stock in a given market index and determines the location of its current price in relation to the 52-week high and 52-week low. We express this relationship using a scale of zero (at the 52-week low) to 100 (at the 52-week high). A stock in the middle of its 52-week range would get a "Rel-to-52" value of 50.
This chart shows the average "Rel-to-52" value for all the stocks in the S&P 500 Index. Not only is there a negative divergence between the indicator and the price index, but the indicator value is only 60. So while the Rel-to-52 value for the S&P 500 is 100 (it is making new 52-week price highs), the indicator value of 60 shows that the number of stocks participating in making the new price highs is unusually low, probably indicating that prices are being supported by larger-cap stocks.
Bottom Line: While the market is making new highs, technical support is fading and a corrective pullback should be expected within the next week or so.


