Two weeks ago I wrote an article that stated that it was a good time for a pullback. As it turns out the pullback started four trading days later, and it appears now that a full blown correction is in progress. It will probably take at least two or three weeks to complete the correction, and there will probably be something of a bounce before the correction low is found.
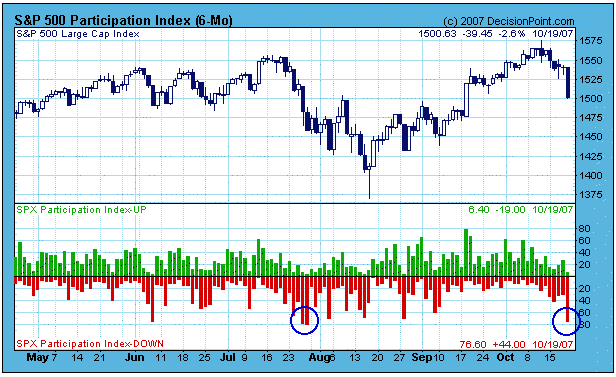
Friday's down move was quite violent, but it also provided evidence that the market is getting short-term oversold. The following chart shows the Participation Index (PI), which measures short-term price trends and tracks the percentage of stocks pushing the upper or lower edge of a short-term price trend envelope. As you can see, on Friday the Down PI reached an oversold level similar to the down spike last summer. While this kind of selling climax indicates that a short-term bottom is near, it is most likely an initiation climax, meaning that any bounce will most likely be followed by more selling. (See last summer's correction.)
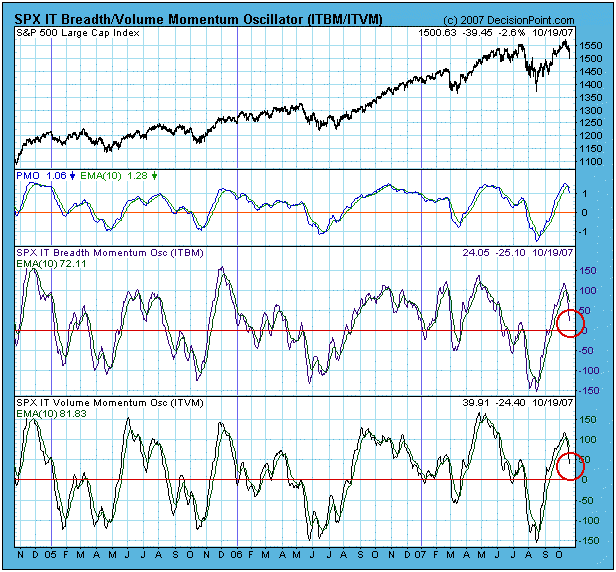
Other indicators show that the market is just coming off overbought levels, and that more corrective action is needed to work off the excesses of the last rally. The next chart shows price, breadth, and volume oscillators. Note that they are moving down, but at least a few weeks will be needed to get them to oversold levels.

Bottom Line: There may be a few more days of selling, but the market is short-term oversold, and we should expect a bounce in a few days. Since it is October, there is a lot of talk about a market crash. With the usual caveat that "anything can happen," my opinion is that conditions are not typical of what we have seen before major crashes. (See my 12/8/2006 article, Crash Talk is Premature.) That does not mean that selling won't continue for longer than I anticipate based upon the above chart. The 9-Month Cycle projection is for a price top in this time frame, with a cycle low projected for mid-December, so, as usual, I'd caution against trying to pick a bottom.


