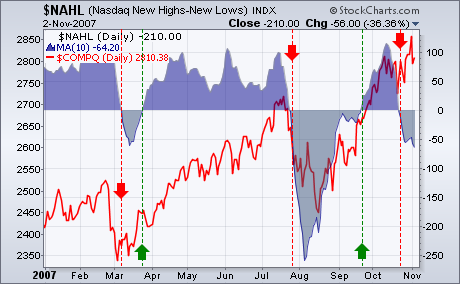
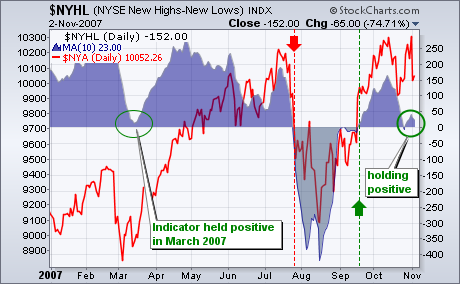
Even though the Nasdaq and the NY Composite hit new closing highs earlier this week, Net New Highs did not keep pace and this could become a problem. Net New Highs equals new 52-week highs less new 52-week lows. I apply a 10-day moving average to smooth the data series and look for crosses above or below the zero line for a trend bias. The bias is bearish when the 10-day SMA for Net New Highs is in negative territory and the bias is bullish when the indicator is positive. On the charts below, the indicator is shown in area format and the underlying index is shown as a red line.
The 10-day SMA for Net New Highs on the Nasdaq moved into negative territory last week. This is quite surprising because the Nasdaq hit a closing high at 2859.12 on 31-October. Despite this new high, there were more new lows than new highs and this undermines the current advance. Something is not quite right. There should be more new highs than new lows when the Nasdaq is trading at or near at 52-week high.
The 10-day SMA for Net New Highs on the NYSE dipped into negative territory last week, but recovered and moved back into positive territory this week. The NY Composite recorded a new closing high at 10311.61 on 31-Oct, but the indicator remained well below its early October high and was barely positive. Net new highs are not keeping pace. There are still plenty of new lows and this reflects bearish undercurrents in the NYSE.


