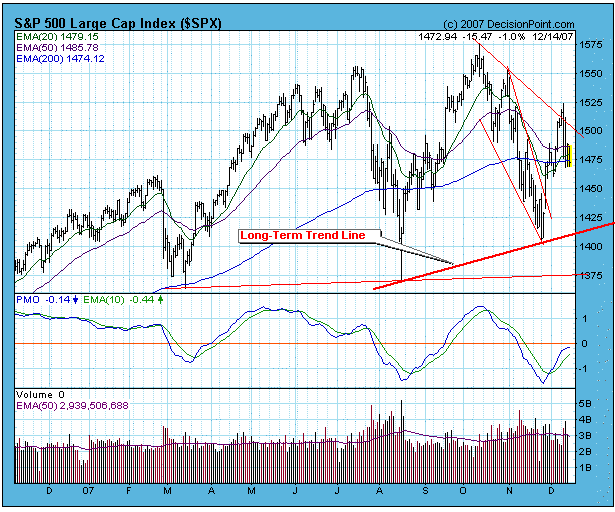
Two weeks ago I stated that the rally off the November lows signaled that a bottoming process had begun, and that, after the short-term rally topped, we should expect a retest of the November lows. Last week the rally was still in progress, and I told Ike Iossif during our interview that I still expected a retest, but that I also feared that the rally would extend j-u-u-u-s-t far enough to trigger a Thrust/Trend Model buy signal before prices reversed downward. As you can see on the chart below, sure enough, the rally topped on Monday (generating a T/TM buy signal), and prices reversed on Tuesday, initiating what ought to be a retest.
I say "ought" to be a retest because so far, in spite of a lot of volatility, it isn't much of a retest in terms of magnitude. I would like to see prices drop to the area of 1425 – at that point I would consider that sufficient technical work has been done to provide a good base for the next rally. Of course we don't always get what we want from the market.
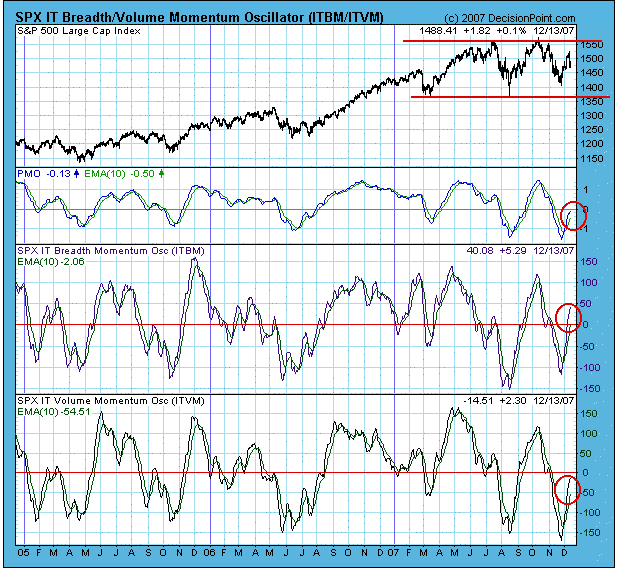
The next chart gives us a view of three medium-term indicators representing the condition of price, breadth, and volume. As you can see, all three indicators risen from very oversold levels and are in the neutral zone. While it is possible for the indicators to rise from oversold to overbought in a single, uninterrupted move, it is more usual for them to reverse once or twice as prices put in a bottom. If prices continue lower, we will see these indicators turning back down.
Another prominent feature on this chart is the trading range in which prices have been moving for most of this year. This is also called a "continuation pattern" – a consolidation that takes place before prices continue moving in the same direction they were moving before the consolidation began, in this case, up.
On the other hand, others may consider the formation to be a double top, which has bearish implications. While I can see the double top argument, we are still in a long-term bull market, and a new 9-Month Cycle is due to begin, so, at this point in time, I expect a bullish resolution.
Bottom Line: Odds are in favor of the retest moving lower, but my guess is that long-term support will hold, and that the retest will be successful.


