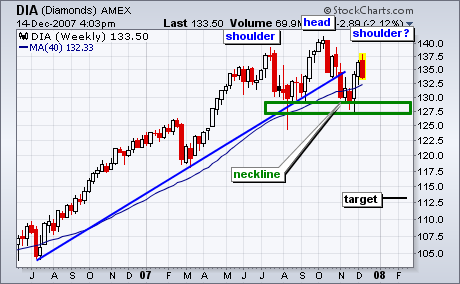
Is that a head-and-shoulders pattern taking shape in the Dow Industrials ETF (DIA)? While it has yet to be confirmed, traders and investors should keep a close eye on this chart in the coming weeks.
The potential head-and-shoulders pattern extends from June to December. The left shoulder formed in July, the head in October and the right shoulder is currently under construction. Notice that DIA opened strong on Monday and finished the week near its lows. In fact, DIA formed a bearish engulfing this week by opening above the prior week's close and closing below the prior week's open. This week's reversal opens the door to a reaction high around 137.5. A peak here and decline back to the support zone would complete the right shoulder. Neckline support rests around 127-129. A break below 127 would confirm this big reversal pattern and project further weakness towards 113.