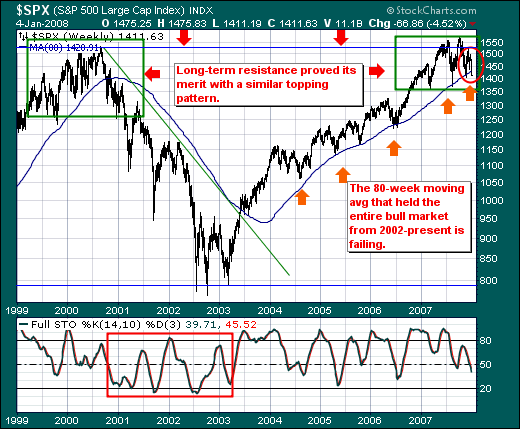
The S&P 500 is off to its worst start to begin a new year since 2000; however, this isn't the larger headline to us. If were writing the story, the headline would indicate the probability of a bear market having begun rose significantly last week; but it did not do so given the very poor US employment report. It did so given our demarcation line between "bull and bear markets" – the 80-week moving average – was violated in earnest last week. We don't take this signal lightly; nor should our clients.
As the S&P 500 Weekly chart illustrates, there is a bit of "symmetry" between the 1999-2000 topping pattern and the current topping pattern as each was unable to breakout above the 1550-1577 zone. In the 2000-2002 bear market, prices clearly broke through the 80-week moving average and didn't look back. It wasn't until 2002 that prices were able to regain this moving average, which signaled the start of the cyclical bull market. Of note, prices successfully tested and retested this moving average numerous times prior to last week's breakdown. Hence, its significance can't be understated.
And one final note. In the first paragraph – we stated the "probability" of a bear market now underway has "risen significantly." We won't sound an all out "bear market call" until the 30-month exponential moving average crossing at 1381 is violated... a mere 30 points lower from current levels.


