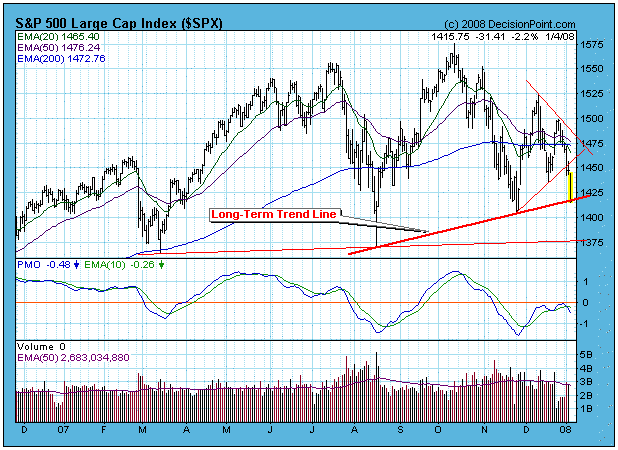
Currently, the stock market is still in the process of retesting the November lows. This process needs to end now or some serious technical damage will be done, specifically the long-term rising trend line is in danger of being decisively violated. On the chart below you can see the long-term rising trend line is being tested, and a decisive violation would be a decline to about 1375, where coincidentally there is another support line. Unfortunately, that doesn't give me much comfort because that line looks a lot like the neckline of a rounded or double top, and considering that a decline to 1375 will generate long-term moving average sell signals, my guess is that the chances of the neckline holding or surviving a retest would be slim to none.
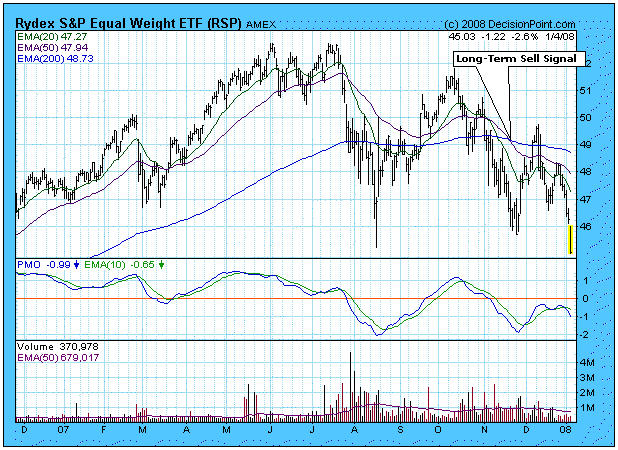
The next chart gives us a view of the S&P 500 on an equal-weighted basis, and the picture is not pretty. Normally, an equal-weighted index will out-perform it's capitalization-weighted counterpart because the index is boosted by the smaller-cap components. However, in recent months the equal-weighted index has been under-performing the S&P 500 Index to the extent that the 50-EMA has already crossed down through the 200-EMA, a long-term sell signal. What this tells us is that money is focusing on the large-cap stocks the S&P 500 Index is being supported by fewer and fewer stocks.
If you are wondering if the 9-Month Cycle has made a low, so am I. I have tentatively identified the trough as being in mid-December, but, since prices have fallen below the mid-December level, I'll have to rethink that after things have shaken out. This is not a satisfying conclusion, but this is often the way it is – cycle projections are good for a longer-term estimate, but it is hard to nail down the exact trough until after the fact.
Bottom Line: It is not impossible for the market to complete a sucessful retest and for the bull market to continue, but the tecnicals are worse than they have been since the last bear market ended, and it is difficult to be optimistic at this point.


