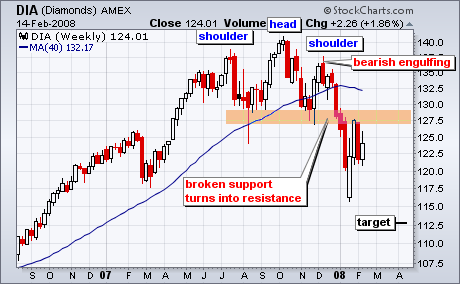
In the 15-December issue of ChartWatchers, I pointed out the possibility of a head-and-shoulders top in the Dow Industrials ETF (DIA). The ETF formed a weekly bearish engulfing pattern that week and this marked the mid December high. Subsequently, DIA moved lower over the next several weeks to confirm this bearish reversal pattern.
This pattern remains in play and broken support is now acting as resistance. This is a basic tenet of technical analysis (broken support turns resistance). The ETF bounced back to broken support at the end of January, but this level turned into resistance as DIA fell back in February. This decline reinforces resistance around 128. More importantly, the head-and-shoulders reversal still dominates the landscape with a downside target around 112.5. The length of the head-and-shoulders is subtracted from the neckline support break for a target.


