This is a rarity. I am proposing that you use line charts - in one instance. A line chart simply connects one closing price to the next closing price. Intraday activity does not appear and is ignored. How in the world can line charts have an advantage over bar charts or candle charts? Well, there's one instance and I'm going to show you.
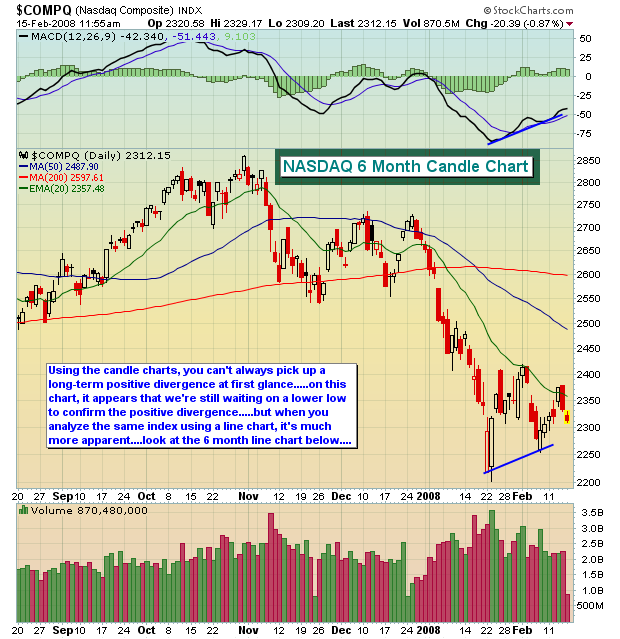
We discussed a couple of weeks ago how the recent lows in the market were accompanied by extreme bearish sentiment readings that many times mark significant long-term bottoms. So far those lows have held. Since that time, long-term positive divergences have appeared providing bulls with evidence that selling momentum has begun to slow. At first glance on a candle chart, it doesn't appear that a long-term positive divergence has printed. Take a look at the NASDAQ candle chart below:
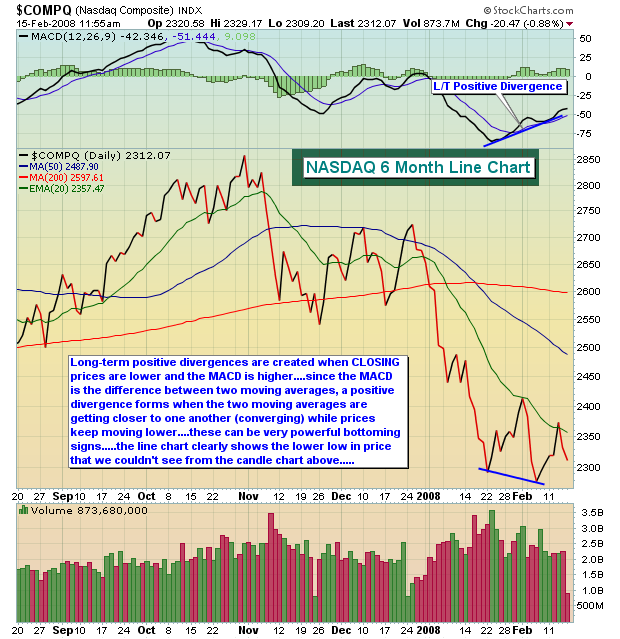
Ahhhh, but wait a second! MACD = Moving Average Convergence Divergence. The MACD represents the difference between two moving averages. We use the standard 12 day and 26 day EMA's (Exponential Moving Average). Moving averages are calculated using closing prices. So if you're looking for a long-term positive divergence on a daily chart, you need to compare the CLOSING prices to one another. That's where the line chart comes in handy because it only connects closing prices. Take a look at that same NASDAQ chart, but this time on a line chart:
The line chart clearly has one advantage. This was an unusual circumstance because of the large gap downs and subsequent rallies that we experienced as the major indices put in their recent lows. We knew there was a reason why line charts were created and this is it!
The long-term positive divergences are yet another technical sign that indicates a bottom may be in place. However, the price/volume combination is our highest ranking technical indicator and it trumps divergences. If the major indices lose their recent lows as support and heavy volume accompanies the selling, that breakdown must be respected. In the meantime, we believe the market is range-bound as it attempts to develop a base from which to rebound longer-term.
Best of luck and happy trading!