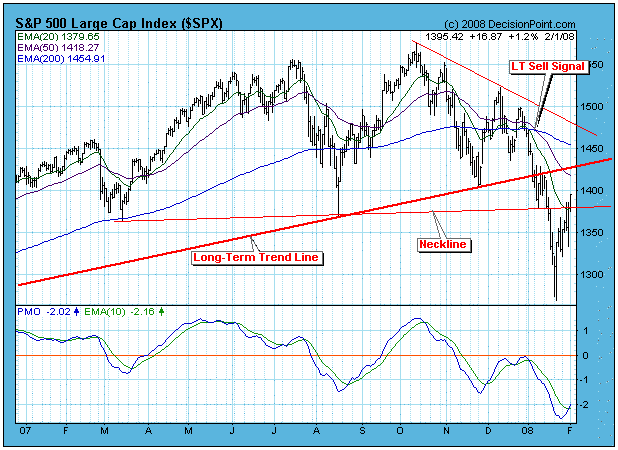
In my January 18 article I asserted that we had entered a bear market based upon long-term sell signals generated by downside moving average crossovers on the daily and weekly charts of the S&P 500. My bottom line summary was as follows: "Probability is very high that the bull market top arrived in October 2007 and that we are now in a bear market that will continue for another year or more, possibly until mid-2010. Until we have evidence to the contrary, remember that bear market rules apply. The next thing to expect is a reaction rally back toward the recently violated neckline support, which is now overhead resistance."
Just a few days later the expected rally began, and the neckline resistance has been penetrated, albeit not decisively. While the market's recent performance has been good for bulls, you can see on the chart below that strong overhead resistance in the form of the long-term rising trend line lies dead ahead.

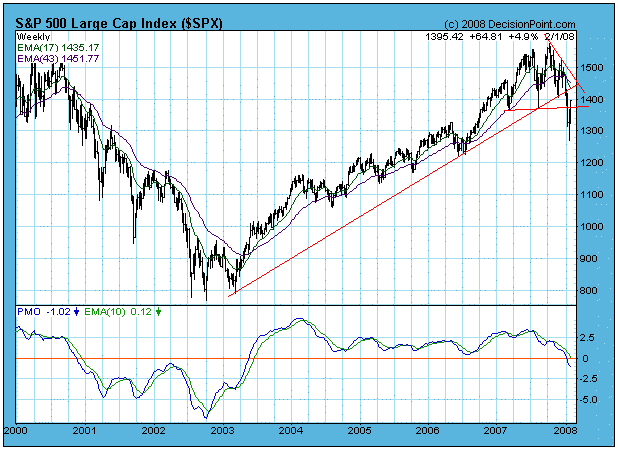
The next chart shows the S&P 500 on a weekly basis. Note that the weekly PMO (Price Momentum Oscillator) has dropped below the zero line for the first time since the bull market began. Observe also that the recent moving average downside crossover is the first since the last bear market began.

Not only is there a lot of resistance to overcome, our short-term indicators show that the market is becoming overbought. Two of my favorites, the CVI and STVO, are shown on the chart below. Both are well into the overbought side of their range, and we should be expecting a short-term price top very soon. Once that top is in place we should expect the recent lows to be retested. Since we are in a bear market, the retest is likely to fail.

Bottom Line: We are in a bear market, and we should expect that most situations will resolve negatively. The recent rally has pushed into a heavy resistance area, and short-term internals are becoming overbought. It is likely that the market will top soon, and that a retest of the recent lows will commence.


