With an oversold bounce over the last two weeks, the Russell 2000 ETF (IWM) is nearing a resistance zone from broken support and the 50-day moving average. Before going further, I should emphasize that the overall trend remains down for two reasons. First, the ETF broke down in January with a decisive move below its 2007 lows. Second, the 50-day moving average is below the 200-day.
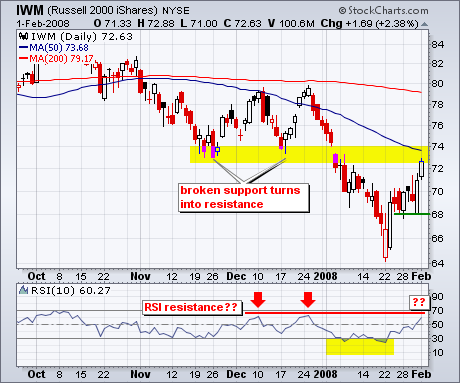
This oversold could fizzle soon because the ETF is nearing resistance from broken support and RSI is nearing its December highs (red arrows). The November and December lows marked support and these now turn into resistance. This resistance zone is further confirmed by the falling 50-day moving average. RSI bounced twice in December, but peaked just below 70 each time. The indicator got another oversold bounce this week and is nearing the spot of its prior reversal. The moment of truth is approaching.


