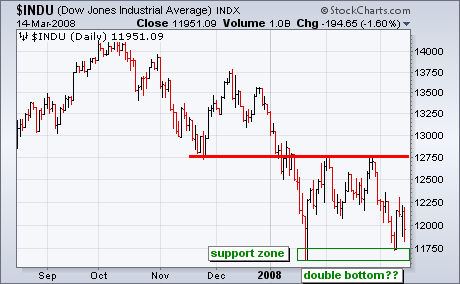
Technical analysis is a little art and a little science, which makes it subjective and open to interpretation. It is kind of like, gasp, economics. With a test of the January lows and a big surge on Tuesday, some pundits are talking double bottom. The interpretation of this double bottom depends on the charting style.
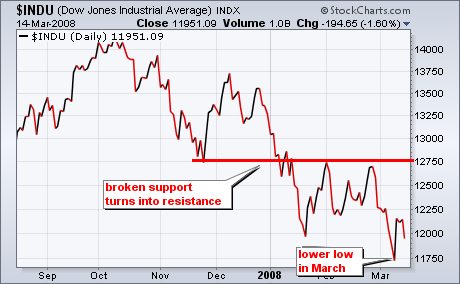
The two charts show the Dow with OHLC bars and with closing prices only. The bar chart sports a potential double bottom with two lows around 11750. In addition, the March low is actually above the February low. However, the close-only chart shows a clear downtrend with a lower (closing) low in March. The close-only chart looks more bearish than the bar chart. Before getting too excited about the double bottom chatter, I would keep in mind the clear downtrend on the close-only chart.