StockCharts.com is pleased to announce that we have just added Kagi and Renko charting formats to our site. Go. Check em out.
Hmmm... Why are you still here? Oh, right. Not everyone knows what Kagi and Renko charts are. Well, lemme show you what a Kagi chart looks like first:
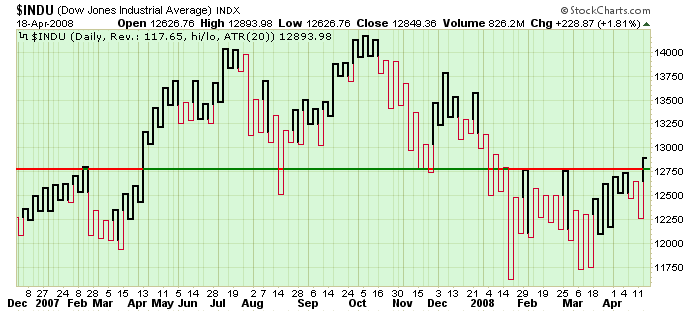
Pretty different eh? It's actually more like a P&F chart than a OHLC or Candlestick chart. For one thing, notice that the horizontal time axis isn't uniform. Just like a P&F column of X's, the thicker lines will go up until a reversal occurs. Similarly, thin lines go down until prices move up again significantly. Notice how the Kagi display makes the support/resistance level clearer on the chart above?
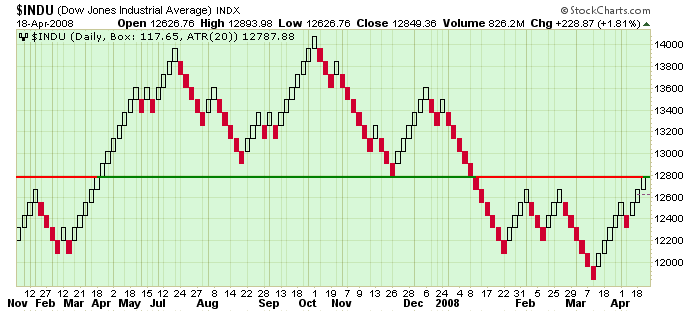
Renko is similar only instead of vertical lines going up and down, boxes are filled at a 45-degree angle during each uptrend and downtrend. Here's the same chart in Renko format:
We are still working on creating detailed ChartSchool articles for Kagi and Renko charts. Until those are done, you can refer to these great discussions on Investopedia.com - one for Kagi and one for Renko.
What? You're still still here? Go play with Kagi and Renko like everyone else! Oh, right. I forget to tell you how to create them. It's really easy. Just select Kagi or Renko from the "Type" dropdown in the "Chart Attributes" section of the SharpCharts workbench. You can even add indicators and overlays - although please be very careful about using those until you fully understand what they are telling you (for instance, a 20-period moving average becomes a 20-reversal moving average).
Have fun learning about these new tools - take time to learn about them and slowly incorporate them into your chart analysis if they work for you.


