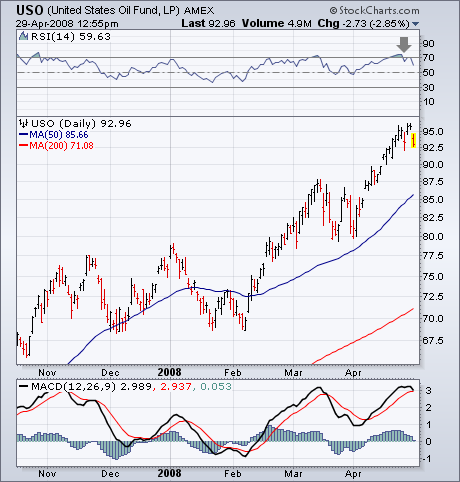
When only one commodity group is hitting new highs, that's usually a sign that it's out of step with the others. That seems to be the case with energy. I still believe that the energy complex is due for some profit-taking. Chart 1 shows the United States Oil Fund still in an uptrend. The 14-day RSI line, however, (top of chart) is backing off from overbought territory over 70. The daily MACD lines (bottom of chart) may be stalling at their March high. That's not a lot to go on. Add in the fact that energy shares are among the day's biggest losers, however, and we see a market group ripe for profit-taking. Chart 2 shows a negative divergence between the 14-day RSI (solid line) and the United States Natural Gas Fund. That's another sign that the recent energy runup is on weak technical footing.