It is rather clear there are ongoing "rolling corrections" beneath the surface in today's markets. In terms of performance, whether one is bullish or bearish on the broader market hasn't made as much of a difference as we would have thought. But understanding where the 'funds' currently stand and where they are likely to 'move' makes a great deal of sense in terms of trading allocation.
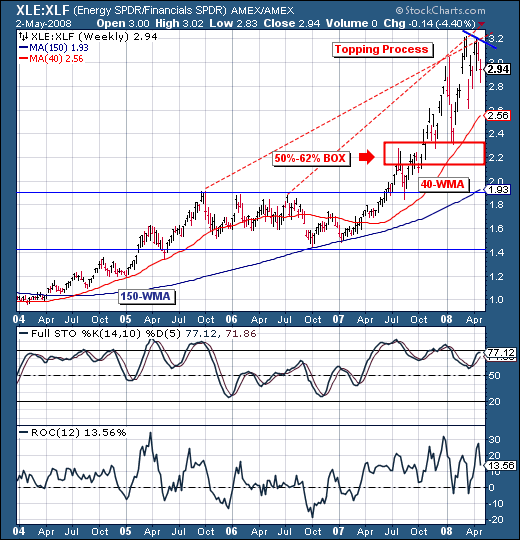
To that end, we want to look at the "long in the tooth" and very profitable pairs trade of Long Energy/Short Financials. In recent weeks, we have begun to see a topping process take place in spread as the 14-week stochastic and 12-week rate-of-change are trading at near overbought levels and more importantly - showing signs of negative divergences - indicating a loss of momentum. Hence, we would posit that this mean reversion trend towards lower prices have quite a bit of downside left in front of it. At a minimum, we expect a test of the 40-week moving average - and at most a test of the 200-week moving average. Or, we can target the 50%-62% retracement box in between. In any case - there remains substantial downside remaining. In our portfolio - we currently have the trade currently on; and are looking to add more.