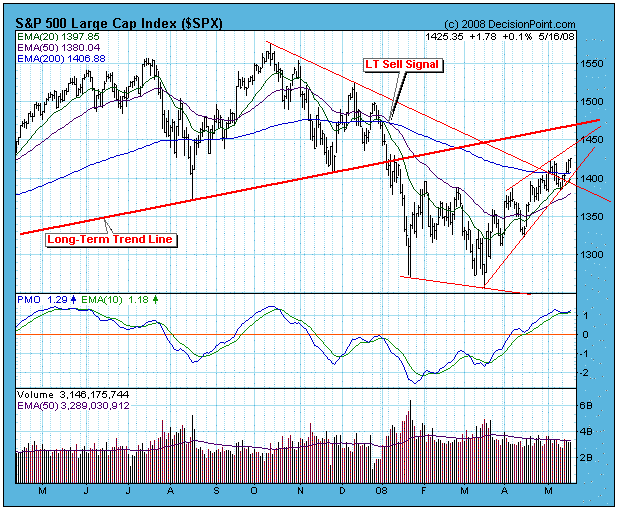
Our long-term model remains on a sell signal, so we have to assume that we are still in a bear market; however, the rally from the March lows has taken prices far enough to cause important bullish signs to appear: (1) The intermediate-term model for the S&P 500 is on a buy signal and has a gain of +5.6%; (2) all but one of the 27 sectors and indexes we track are on buy signals with an average gain of +6.6%; (3) prices have moved above the declining tops line drawn from the October top; and (4) the weekly PMO has bounced from oversold levels and generated a buy signal by crossing above its 10-EMA. I can put up a pretty good argument for the bullish case, but the long-term sell signal stands in the way of excessive optimism -- it takes a lot of negative energy to generate the sell signal, and it will take a lot of positive energy to reverse it. Fortunately, our medium-term model lets us be cautiously long early in the rally just in case a new bull market really has started.
While things are looking pretty positive, a few negatives are beginning to appear. One is an ascending wedge formation that you can see has formed since the March low. I have observed that this formation is one of the most reliable there is -- it most often resolves to the downside. Another negative is that the market is getting overbought. Note that the daily PMO is in the overbought zone.
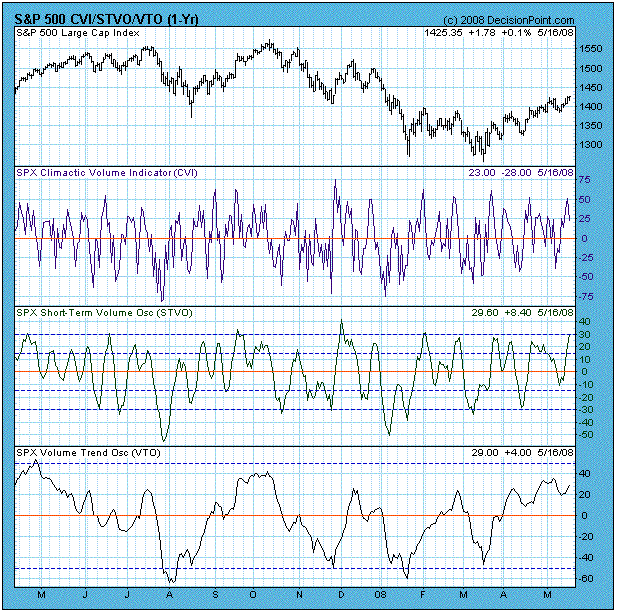
More evidence of the market's overbought condition is the OBV (on-Balance Volume) suite of indicators on the chart below. Note that the CVI has topped and the STVO has reached the top of its range. Combine this with the ascending wedge price formation, and the overbought PMO, and I think the market is setting up for a short-term pull back at the very least.
Bottom Line: The market is showing many positive signs, but it is getting somewhat overbought and we should be looking for at least a short-term correction.


