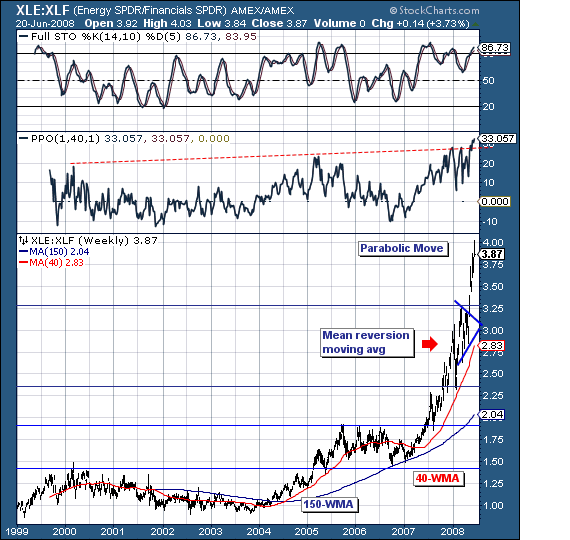
As the world stock markets have embarked on what arguably is another "leg lower"; we are left to wonder aloud what the relative rotation beneath the surface of this decline will look like in terms of tactical allocation. Our focus has been upon the S&P Energy / S&P Financials Ratio (XLE: XLF) as of late, for there is quite a bit of pent-up leverage extant in this chart as the world's hedge and mutual funds are very clearly very long energy and clearly very short financials. At some point, the leverage of reversing this position by being short energy and being long financials will produce enormous gains to one's portfolio. Clearly, it shall make one's trading year or perhaps even one's trading lifetime when it materializes. The question is one of "when" and not "if" in our minds.
Taking a technical look at the ratio chart, it clearly illustrates the parabolic move began in earnest at the beginning of 2007 from the 1.50. Now, we all know that parabolic moves end badly and in a "trail of tears", with this one highly likely to do so as well. Currently, the ratio trades at 3.87, with a majority of this move occurring since the beginning of 2008. We're mean reversionists at TRR; hence we're looking for a mean reversion exercise towards the 40-week moving average given the ratio stands +33% above this level - a historical record indeed. Moreover, the stochastic indicator has moved back into overbought levels...that in the past have provided for a "top" once it turns lower. In other words, the balance of risks is pointed downward, which when combined with the absolute "love fest" shown energy stocks and absolute "disdain" accorded the financials...are the conditions such that can a reversal lower not be far off?
Good luck and good trading, Richard Rhodes Capital


