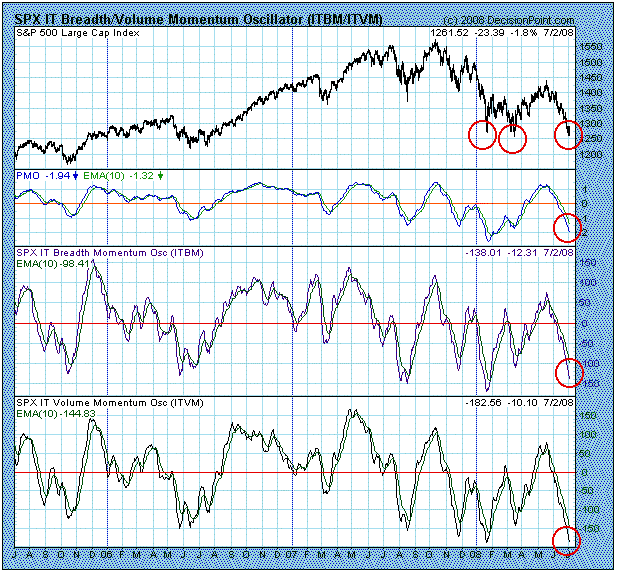
A bullish take on the stock market would be that (1) market indicators are very oversold, (2) there is a triple bottom setup on the S&P 100 Index, and (3) sentiment polls show a lot of bearishness. I agree that those conditions exist, but we are in a bear market and these conditions can easily see price movement transition into a crash. The reason, as I have said many times before, is that bullish setups don't always work so well in bear markets, and an oversold market can very quickly become significantly more oversold.
Let me be clear, I am not predicting a crash. If the market does crash, I will not claim to have "called" it, because that is not what I am trying to do. I want my readers to be aware of the danger and not try to pick the exact bottom of this decline. That bottom could be very far away.
Our first chart contains three indicators (one each for price, breadth, and volume), and you can see that they are all very oversold. You can also see the triple bottom setup. This oversold condition is repeated on most of our other indicator charts.
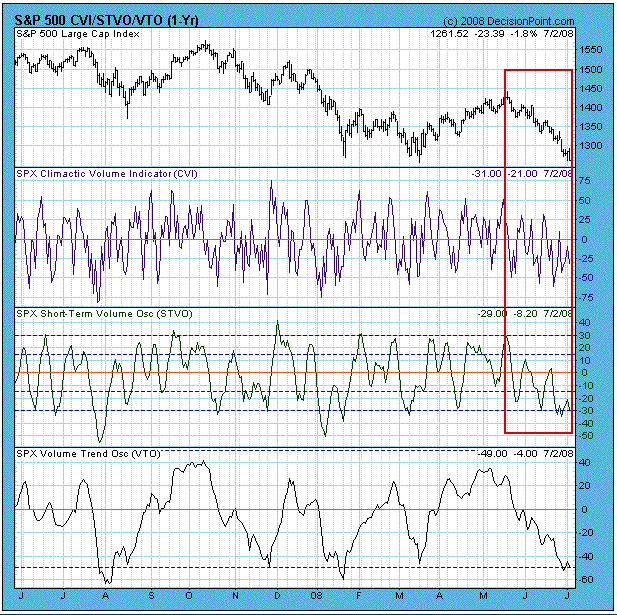
The next chart looks more closely at how prices have been behaving in response to short-term oversold conditions. Note how during the recent decline that oversold indicator readings have not resulted in anything but tiny advances that were quickly followed by continued price declines. This is typical bear market behavior, and it implies that medium-term oversold readings may be just as soft.
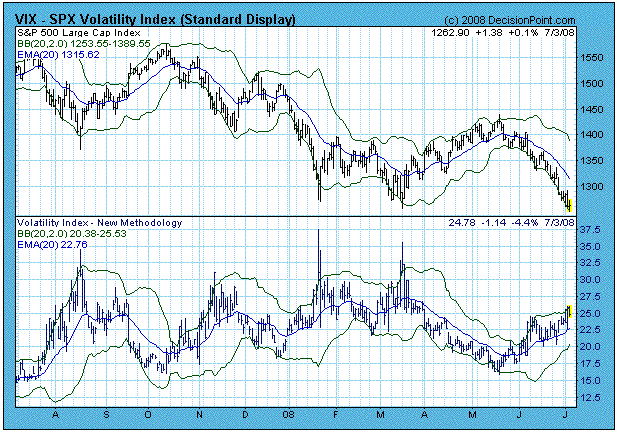
Our final chart gives us a view of just how much complacency exists, in spite of widely negative sentiment readings. The Volatility Index (VIX) is derived from prices on near-term SPX put and call options. Higher readings reflect a high level of fear among options traders, and lower readings complacency. Note the upside spikes on the VIX at the January and March lows. Now note how the VIX is currently about mid-range, even though prices are making new lows. This shows a surprising lack of fear, considering what prices are doing. (Thanks to Ike Iossif for bringing this to my attention.)
Bottom Line: We are in a bear market, and it is suicide to try to take positions anticipating the next rally merely on the evidence that the market is very oversold. Conditions are such that a sharp decline could materialize at any moment. This is not a prediction -- I don't suggest placing bets on it -- just something that traders should consider. Bear markets are dangerous. Wait for solid evidence that a rally has begun before sticking your neck out.
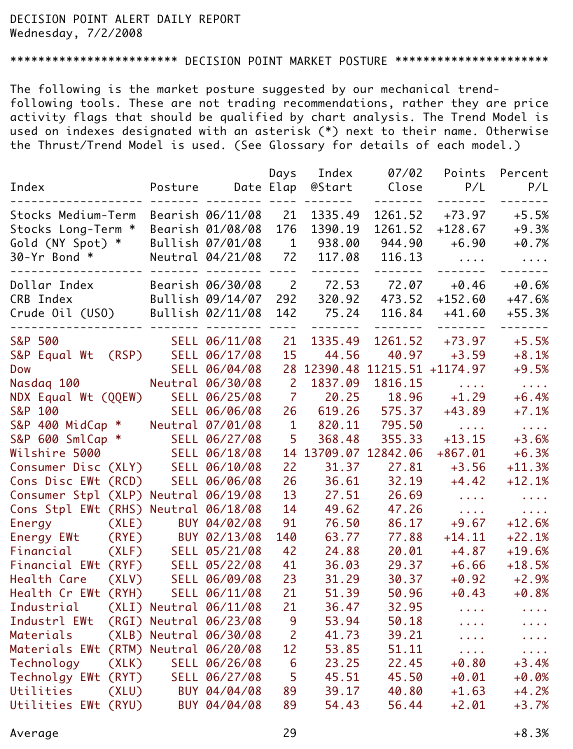
We rely on the mechanical trend models to determine our market posture. Below is a recent snapshot of our primary trend-following timing model status for the major indexes and sectors we track. Note that we have included the nine Rydex Equal Weight ETF versions of the S&P Spider Sectors. This may seem redundant, but the equal weighted indexes most often do not perform the same as their cap-weighted counterparts, and they provide a way to diversify exposure.


