We'll admit last week was one of the more "interesting" trading weeks we have seen in a number of years, and if we must liken it to anything we've seen in our 25-years of trading - it would be the week before and of the 1987 Crash. The question we and many others have is whether last week was "The Low" or just "A Low" in the stock market; and to be perfectly frank...we don't know. But perhaps the most important chart in our trading universe at the present time is the simple "tactical allocation" ETF ratio chart between stocks and bonds - we use the S&P 500 Spyder (SPY) and the Lehman 20+year Bond Fund (TLT) ratio as our guide. In essence, this is a "risk-aversion" chart.
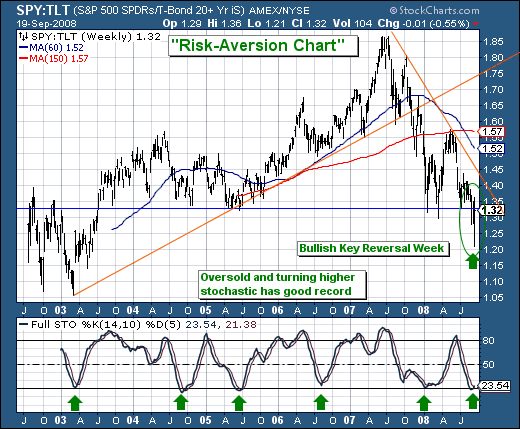
Quite simply, as stocks have moved lower, we've seen bond prices move higher/bond yields move lower as institutions/investors/traders have sought out the safety of the bond market at the expense of stocks. This resulted in the SPY/TLT ratio chart moving lower; and it has done so since July-2008 - breaking major support levels along the way. However, last week's unprecedented government intervention related to collapsing credit markets pushed stocks higher and bond prices lower/bond yields higher as market participants "feared" losing more money in the bond market as yields rose, with the only place to put that cash was in money market funds or in stocks - they chose stocks.
Hence, a bullish key reversal has formed off quite low levels, which the 14-week stochastic turning higher from oversold levels. In the past, this has led the ratio higher and coincided with higher stock prices. Whether or not we or you agree with the government intervention - the technicals are showing that last week was at least "a bottom", with the jury still out as to whether it was "the bottom." As we move forward, we'll certainly be able to fill in more of the myriad of technical blanks. Until then, sector and industry tactical long and short rotation will be paramount to outperformance.


