In my September 5 article I said that I thought is more likely that we would see a continued decline, rather than a retest of the July lows. This week the market blew out the July lows and was very near to crashing on Thursday. Then prices blasted up out of the lows in a dramatic upside reversal. There was good follow through on Friday, and now we must ponder if a significant bottom has been made.
With historic levels of fundamental turmoil in the financial markets, and unbelievable volatility in prices, it is extremely difficult to keep a level head and keep focused on technical basics. I am reminded of my flying days and the primary directives for emergency procedures.
- Maintain aircraft control (don't panic and crash for no good reason).
- Analyze the situation, and take corrective action.
I have always thought of these rules as being appropriate for handling all of life's problems, and they especially apply to the current problems in the stock market. No matter what your current situation, you can't go back and start over. You are stuck with what you've got, so do your best to work through it.
Getting back to the charts, we can see below that prices are still in a long-term declining trend channel, which currently defines the bear market. The rally is approaching a declining tops line, and it will probably penetrate that resistance and head higher, possibly to test the bear market declining tops line. The most interesting feature is the positive divergence between the PMO and the price index -- while price made a lower low, the PMO made a higher low.
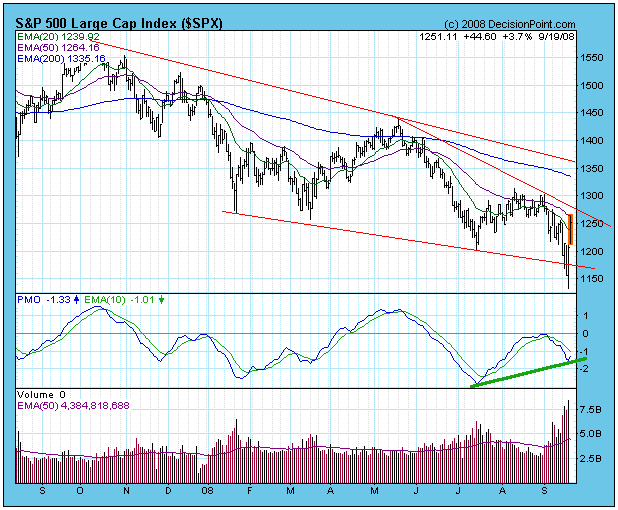
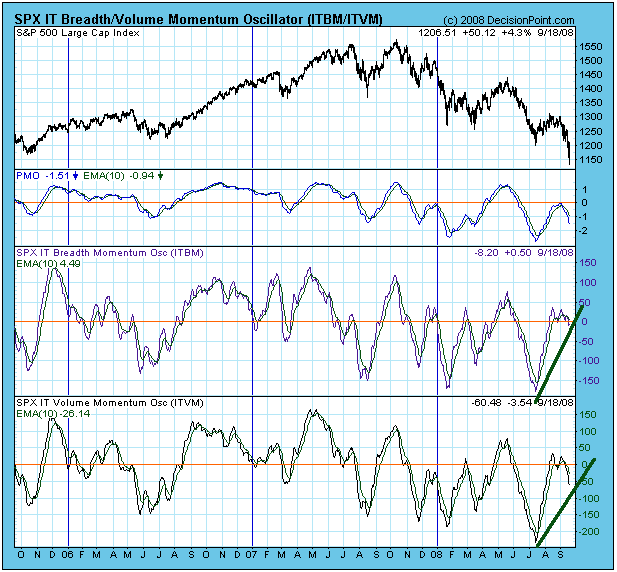
There are also positive divergences on our primary breadth and volume indicators shown on the next chart. These positive divergences are bullish.
Our indicators and price action suggest strongly that we are beginning a rally that should last at least a couple of weeks. I also think that this week's deep low needs to be retested, and I am not convinced that a retest will be successful. My cycle work projects that a 9-Month Cycle low is due at the end of October -- about the time a retest would take place -- and cycle forces could take us to a new price low.
It is worth mentioning that the unprecedented avalanche of failures and bailouts is likely to get worse before it gets better, and we must wonder if a meltdown is over the horizon.
Bottom Line: While we continued to be buffeted by one crisis after another, the best thing we can do is "stay on instruments" (keep our eyes on the charts). At present, the charts say the rally is likely to continue, albeit not at the current rate of climb. At the end of the day, we are still in a bear market, and we should expect that the rally will fail before prices can break out of the major declining trend channel.


