Hello Fellow ChartWatchers,
Recently we've gotten several questions about how someone can display more than one stock on a single chart. I thought I'd take time this week to go over the steps you can take to do that with our SharpCharts Workbench. Let's get started.
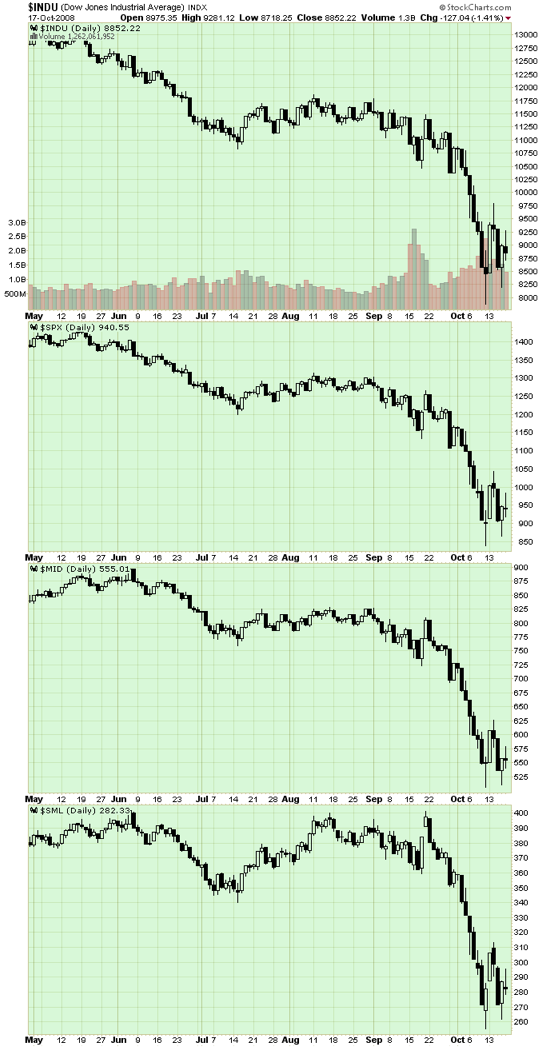
In this example, we'll create a chart of the Dow with the S&P Large Caps, Mid Caps, and Small Caps below it.
Create a chart of your "first" stock
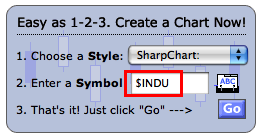
There are several ways to create a new SharpChart. The easiest is to just go to our homepage and enter "$INDU" into box for step #2, then press "Go".
Remove any existing Indicators and Overlays
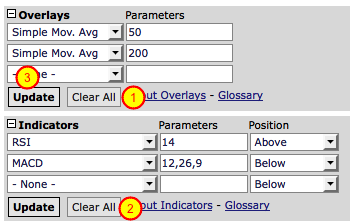
To make things easier, let's remove any Indicators and Overlays on your default chart. The quickest way to do that is to click the "Clear All" buttons in the "Overlays" area (#1) and "Indicators" area (#2). Be sure to click the "OK" button to confirm each removal. Finally, click the "Update" button (#3) to display your clean chart.
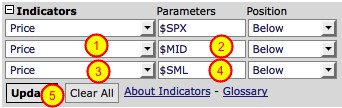
Add the "second" stock as a "Price" indicator
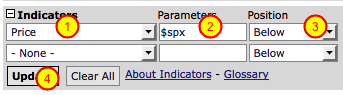
So here's the magic: You can use the "Price" indicator to add additional ticker symbols to your chart. Simply select "Price" from one of the empty indicator dropdowns (#1) and then enter the ticker symbol you want to chart in the "Paramaters" box (#2). In our case, we want to use "$spx" (which is, coincidently, what is automatically added). Finally, we want the $SPX plot to appear underneath our current Dow chart, so we need to make sure that the "Position" dropdown is set to "Below" (#3). Finally, as always, let's click the "Update" button (#4) to see what we get.
Checking our progress so far
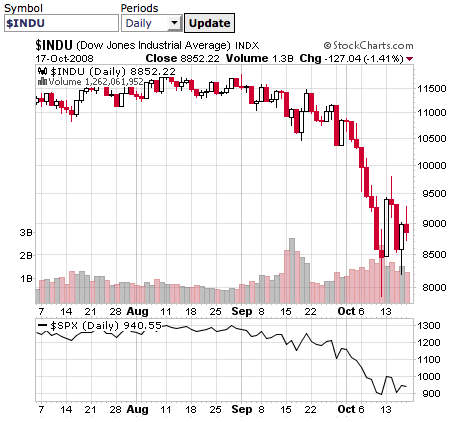
At this point, you should have a chart that looks similar to the one above. (Note: Members that have changed their Default chart settings will probably see some differences in any areas that they changed.) Note that $SPX now appears below the chart of $INDU.
Add the other two ticker symbols
Let's add the other two indices by repeating the process we just learned. Don't forget to change the value in the "Parameters" boxes (#2 and #4) to $MID and $SML. When you're done, click the "Update" button (#5) to see the results.
Checking the results
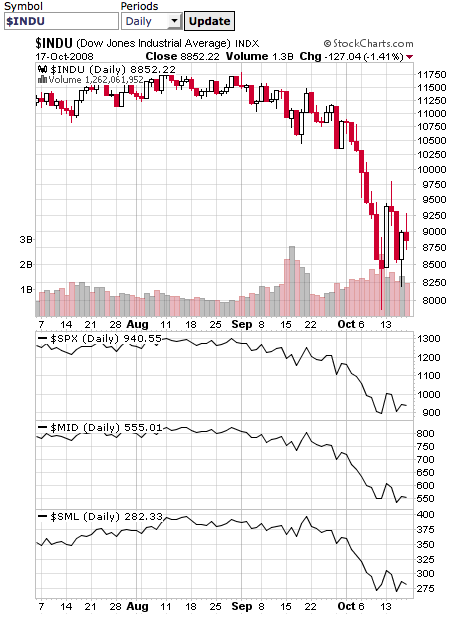
You should see something very similar to the chart above. This is about as good as a Free User of StockCharts.com can get. StockCharts.com members however have some very powerful additional capabilities that I want to look at next.
Opening the Advanced Options area
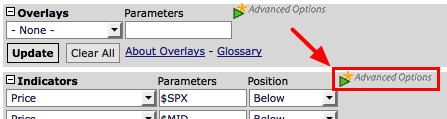
Members who are logged in should see the green "Advanced Options" triangle located just to the right of the "Indicators" area. (Don't confuse it with the one next to the "Overlays" section.) If the Advanced Options area isn't already on your screen, click that green triangle to make it appear.
Change to an "All Candlestick" chart
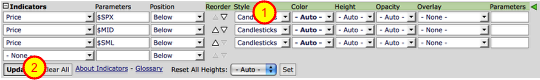
Let's display the other indices as candlesticks instead of line plots. Find the "Style" dropdowns (#1) and change all of them from "- Auto -" to "Candlestick", then click "Update" (#2). You should see 4 candlestick plots on your new chart. Terrific! But wait... The three indices' plots are not as tall as the $INDU plot. Let's fix that.
Increase the height of the Price plots
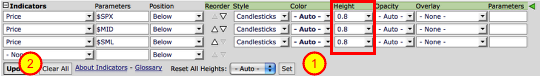
For this example, we want the indices' to be 80% as tall as the Dow chart. The quickest way to do that is to use the "Reset All Heights" dropdown (#1). Select "0.8" from that dropdown, then click the "Set" button. As soon as you do that, all of the "Height" dropdowns (red box) are changed from "- Auto -" to "0.8". You can then click the "Update" button (#2) to see the results.
Checking our progress
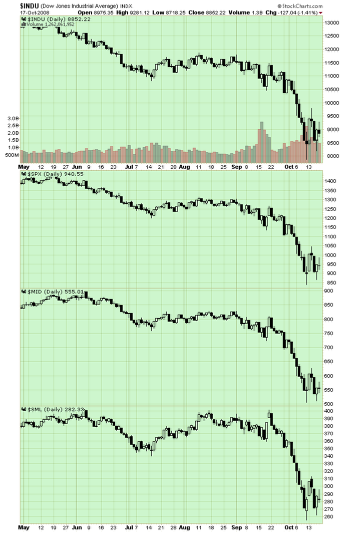
You should see something similar to the chart above (which has been scrunched down to save screen space). Four candlestick plots of different ticker symbols in one chart - pretty cool! There's still one more thing I want to add however - time scales for the $SPX and $MID plots.
Adding more time scales
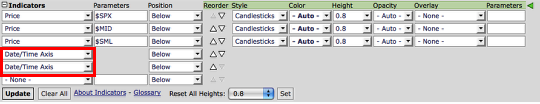
Back down in the "Indicators" area, select "Date/Time Axis" in the empty indicator dropdown. Then do it again so that you have two of them (red box).
Move the time scales into position
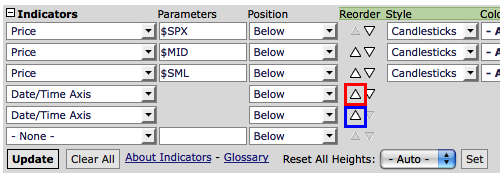
Find the "Up" triangle in the "Reorder" column that's next to the first "Date/Time Axis" (Red Box). Click on that triangle twice to move that "Date/Time Axis" line directly under the "Price" indicator for $SPX. Next, find the "Up" triangle for the second "Date/Time Axis" (Blue Box) and click on it once to move it under the "Price" indicator for $MID. Finally, click "Update" to see our finished masterpiece!
Click here to see a live version of this chart.
As with all forms of power, this one does come with some limitations. Free users and Basic members can only add up to 3 additional ticker symbols to any chart. Extra members can add up to 6.
Sorry for the length of this article, but I wanted to be absolutely sure that everyone knows how to use this important capability. Hopefully you can take the lessons from this demonstration and improve your charts as a result.
- Chip


