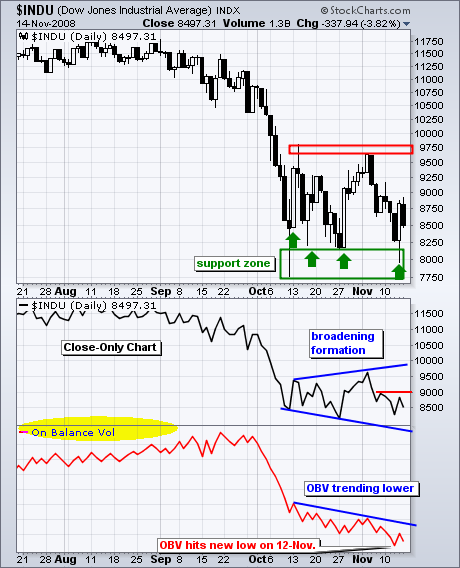
The Dow Industrials surged off support for the fourth time in five weeks. Will this bounce produce a breakout or failure? As the candlestick chart below shows, the Dow Industrials is locked in a volatile trading range with support around 8000 and resistance around 9700. The Dow dipped below 8250 least four times and surged above 9250 at least three times. Talk about a yo-yo.
In an effort to weed out some of this volatility, I am also looking at a close-only chart. There are three dips below 8500 and a broadening formation is taking shape. These patterns are normally associated with tops, but we can probably apply some reverse logic with one forming after the Sept-Oct decline. Currently, the Dow is moving from the upper trendline towards the lower trendline, which targets further weakness towards 7800-8000. Thursday's big bounce looks impressive, but it is not quite enough to reverse the two week downswing. Sorry for getting so short-term, but these are big swings we are dealing with. While I was impressed with Thursday's surge, it was just one day and Friday proves that some follow through is needed for confirmation. A close above minor resistance at 9000 would provide such follow though.
The bottom indicator shows On Balance Volume (OBV) moving to new lows this week. Joe Granville theorized that volume leads price. If this is the case, then OBV is pointing to new lows for the Dow. Look for a break above the blue trendline and early November high to reverse the downtrend in OBV.
There is also a video version of the this analysis available at TDTrader.com - Click Here.


