Decision Point charts a couple of indicators that are useful in determining investor sentiment based on actual deployment of cash into Rydex mutual funds. The Rydex Asset Ratio is calculated by dividing total assets in Bear plus Money Market funds by total assets in Bull funds. The Rydex Cash Flow Ratio is calculated by dividing Cumulative Cash Flow into Bear plus Money Market funds by Cumulative Cash Flow into Bull funds. (A thorough discussion of these ratios can be found in the Glossary section of our website.) When total assets in a given fund increase/decrease, the cause is an advance or decline in the fund's shares; however, there is also a component of the amount of cash moving into and out of the fund. This is why we have the two indicators.
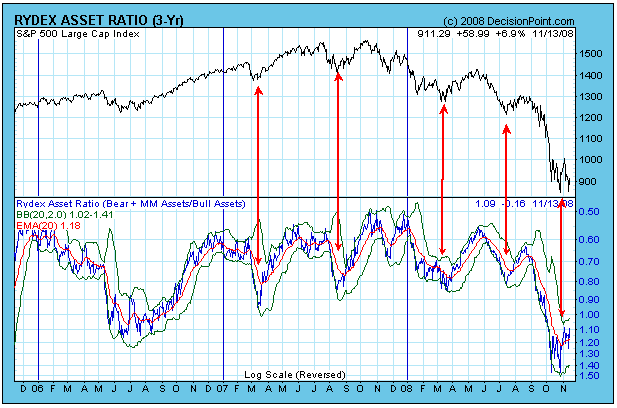
On the Assets Ratio chart below, we can see that the Ratio is deeply oversold, implying that sentiment is very bearish, and that an important price bottom is being formed. This oversold reading is a direct result of the severe market decline depressing bull fund prices and inflating bear fund prices. The next chart shows a completely different picture.
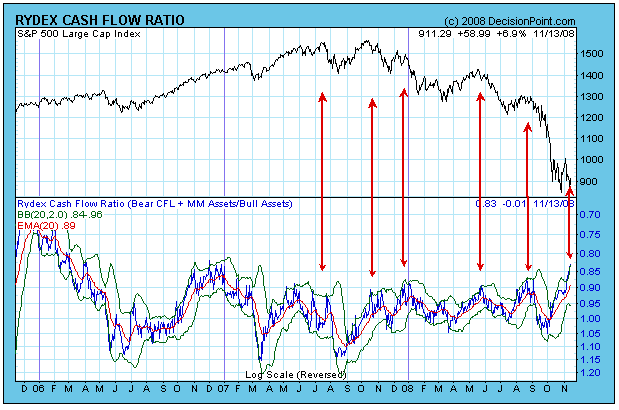
While the Asset Ratio is oversold and bullish, the Cash Flow Ratio below is overbought and bearish. It is telling us that investors are quite bullish, and that a decline should be expected. That the two Ratios have diverged so severely is a very unusual situation, so let's take a closer look at what happened.
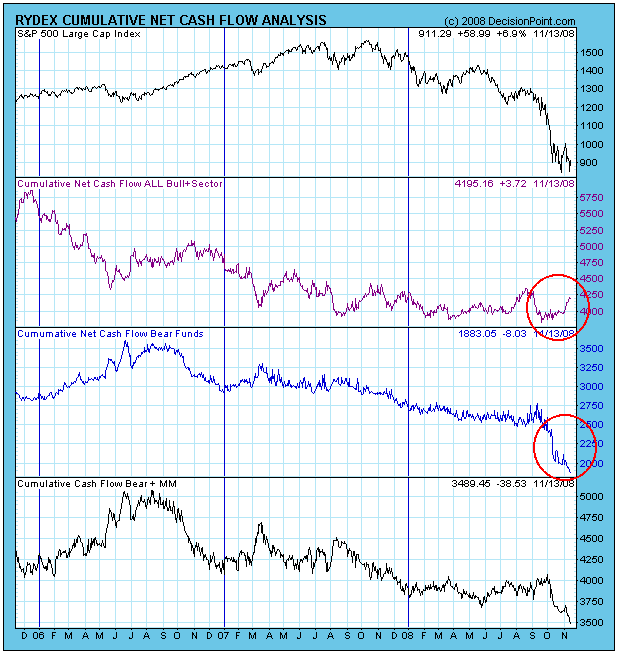
The next chart shows that, when the market began to consolidate, cash flowed out of bear funds and into bull funds. I can think of no other reason except that Rydex investors were anticipating a rally and trying to pick a bottom. This is bearish. I should emphasize, however, that the Ratios reflect the activity of a relatively small percentage of total market participants. Nevertheless, these indicators have a good performance record and are useful tools.
Bottom Line: The current divergence of the Rydex Ratios leaves us in a predicament as to which we should believe. In my opinion, the Cash Flow Ratio shows what is happening beneath the surface of asset totals, and it should be the first to be believed.


