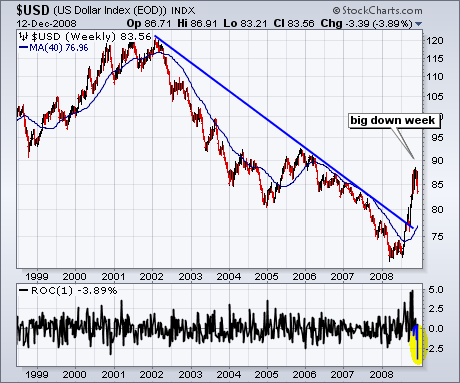
After surging from the low 70s to the upper 80s, the U.S. Dollar Index ($USD) experienced its sharpest decline in years. In fact, this week's decline was the sharpest in over 10 years. The bottom indicator window shows the 1-week Rate-of-Change dipping to -3.89% this week. While this may seem like a trend changing event, keep in mind that the Dollar was quite overbought after the prior advance. Some sort of correction is normal and the index could very well retrace 50% of the prior advance.
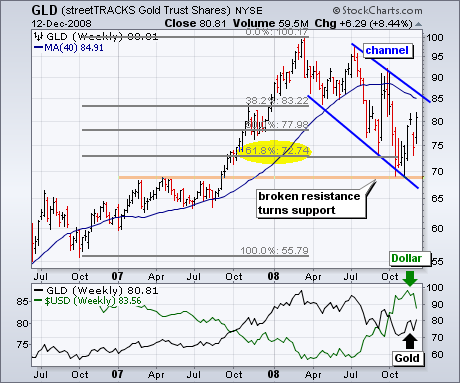
Weakness in the greenback sparked a rally in gold this week as the streetTRACKS Gold ETF (GLD) gained over 8%. The surge off support looks impressive, but GLD remains in a falling price channel for the year. This pattern, however, could be bullish because it looks like a massive flag. Flags are corrective patterns that form after a big advance. A break above the 40-week moving average and upper trendline would signal a continuation of the prior advance (55-100).
There is also a video version of the this analysis available at TDTrader.com - Click Here.


