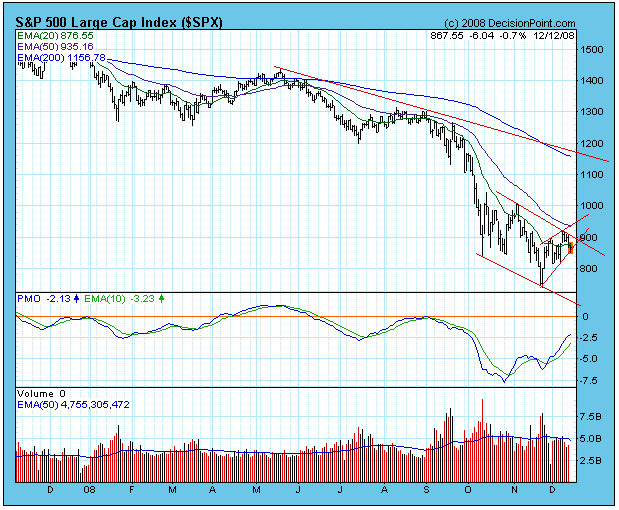
Last week we looked at a descending wedge pattern on the S&P 500 chart that could have sparked a rally had it resolved to the upside. Prices actually did break upward, but volume was poor, and the up move stalled immediately. Now there is an ascending wedge pattern inside a declining trend channel. The technical expectation is for the wedge to resolve to the downside, but I should emphasize that it would only have short-term implications.
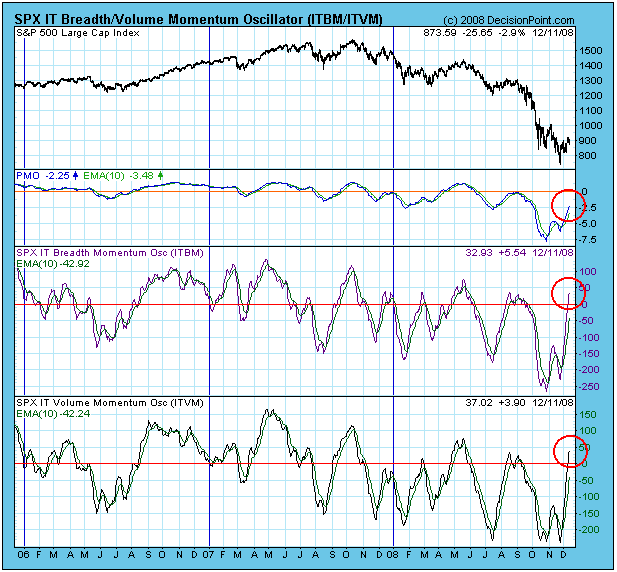
I am becoming more concerned with the medium-term prospects for the stock market. In late-October the market became extremely oversold by virtually every measure. This was a signal for us to start looking for an important rally. Since then, the oversold readings have been getting worked off as the market has been grinding sideways and lower. As you can see on the chart below, three of our medium-term indicators for price, breadth, and volume have been moving up and are relatively overbought (relative to their recent trading ranges).
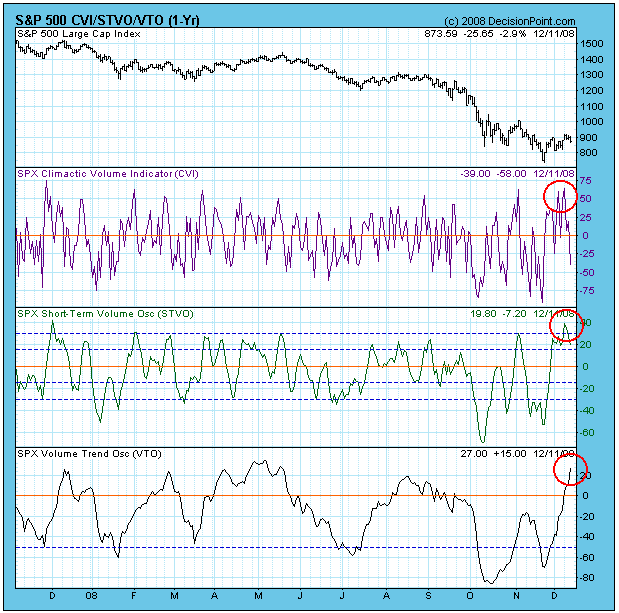
On the chart of our OBV suite of indicators below, note that the medium-term VTO (bottom panel) is at overbought levels. The short-term CVI and STVO have also peaked in overbought territory.
Bottom Line: There has been a small rally out of the November lows, but volume has been weak. Deeply oversold readings have so far failed to deliver a rally of the strength and duration we would normally expect, and, with internals now becoming overbought, time is running out. The problem, I suspect, is that the only buyers are nervous short sellers. Once the shorts have covered, new buyers needed to continue the rally fail to materialize because nobody wants to buy this market.


