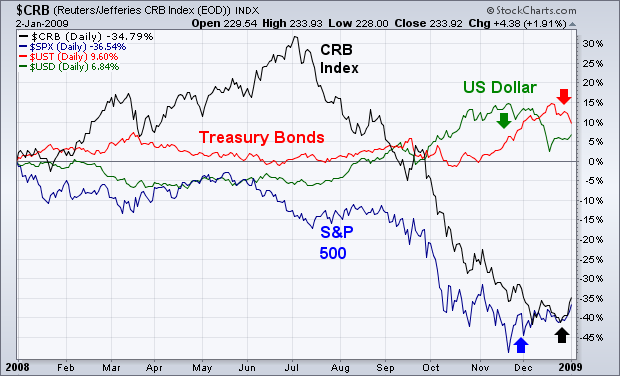
Chart 1 shows how the interaction between the four main asset classes unfolded during 2008 and how they're entering 2009. The two weakest assets were commodities and stocks. The two strongest were Treasury bonds and the dollar. During the first half of the year, commodities were the strongest asset class while the others lost ground. At midyear, however, a sharp rally in the dollar (green line) caused a massive collapse in commodities (black line) which continued until November. Treasury bonds (red line) rallied sharply on plunging commodities. During most of the second half, bonds and the dollar rallied while stocks (blue line) and commodities fell together. [During a recession, bond prices usually rise while stocks and commodities fall]. Starting in November, however, those trends started to reverse. The stock market started to recover as the dollar weakened. As we enter the new year, stocks and commodities are bouncing while the dollar and bonds are pulling back. While those trend reversals are still relatively small, they do suggest that investors are entering the new year in a more optimistic mood.