Hello Fellow ChartWatchers!
First off, Happy 2009! Let's hope this year is better than 2008 - one of the all time stinkers in terms of stock market performace. How bad was it? Here ya go:
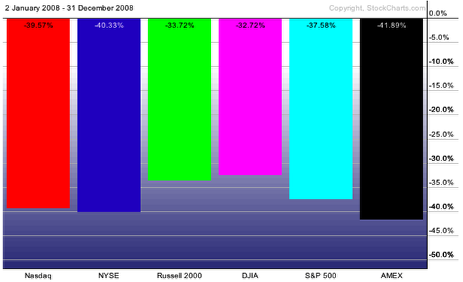
Ugh. Well, let's not dwell on it too much. Instead I wanted to talk about another "hidden gem" feature of our website that can help subscribers get the most bang for their charting buck. Last time I talked about ChartStyles - templates of chart settings that you can save into your account. This week I want to show you how you can hook your saved settings up to small, easy to use buttons called StyleButtons that let you access you most important ChartStyles instantly.
First I want to show you how you can create a StyleButton for your Default style. If you've set up your account correctly you should have used the "Save As Default" link to customize the initial appearance of your charts so that they look the way you prefer. By doing that you've created a special ChartStyle called ">>Default<<". Let's assign a StyleButton to ">>Default<<" so that you will always have access to that style with a single mouseclick.
Start by logging into your account and then entering a ticker symbol in the QuickChart box in the upper right corner of the page. I used $COMPQ, the Nasdaq composite:
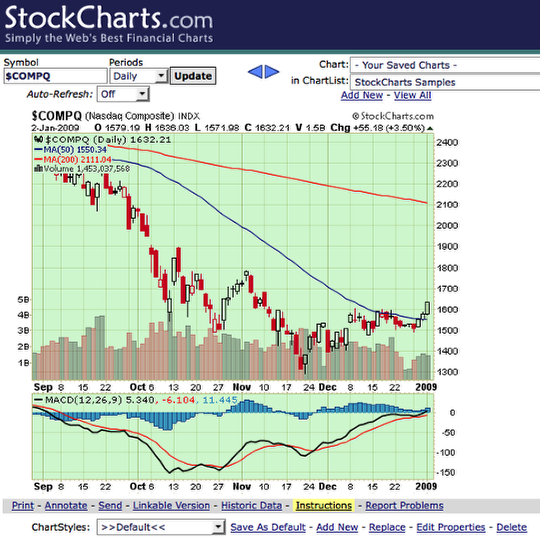
So this is what my current "Default" style looks like. Often, after experimenting with lots of different settings, I want to give up and quickly get back to this view. There are several ways to do that, but by adding a ChartButton I can do it in one click. To add a ChartButton for this default style simply click on the "Edit Properties" link in the "ChartStyle" area below the chart:
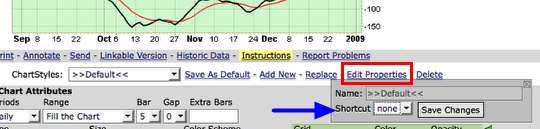
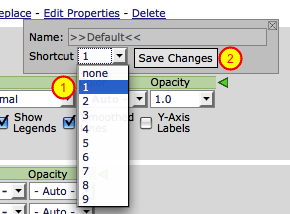
When you click on "Edit Properties", a popup box appears whith some settings. The one we care about is the "Shortcut" dropdown. That dropdown contains a list of numbers. Each number corresponds to a StyleButton position on the left side of the chart. Since we'd like our "Default" StyleButton to always be at the top of the chart we'll set the "Shortcut" dropdown to "1" and then press "Save Changes"
After saving that change our workbench page now looks like this:
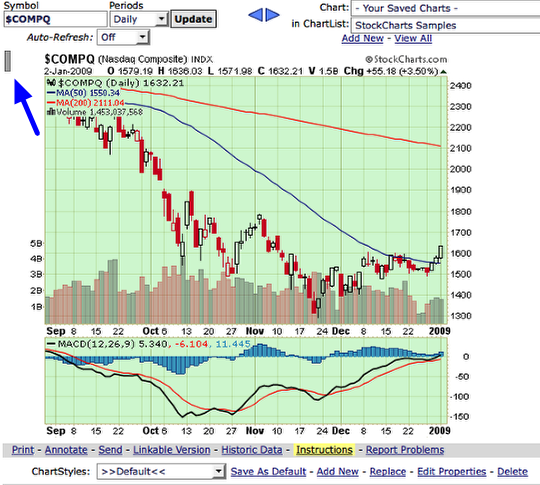
Notice the difference? It's subtle but there is now a grey button just to the left of the top of our chart. That is a StyleButton. If you move your mouse over that button you'll see its name (">>Default<<" in this case). Clicking that button will now always bring you back to your Default style.
StyleButtons are most useful when you have several that show you different views of the same stock - for instance a Long-term view and a Short-Term view. To create a new StyleButton first create the ChartStyles that you will use with the "Add New" link then simply assign a "Shortcut" number to any of the styles that you want to make into buttons. When you are done you should see something like this:
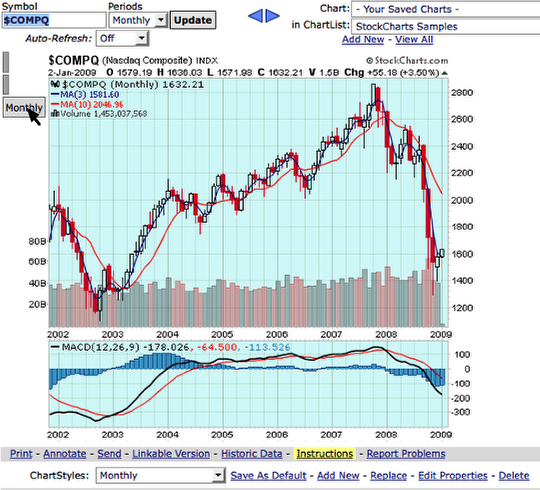
In the example above I've created a "Weekly" style for button #2 and a Monthly style for button #3. My mouse is over button #3 so that you can see its name - as soon as I move my mouse away the name disappears.
As you can see StyleButtons give you one-click access to any kind of chart analysis you can imagine. Maybe you want a Renko style, a 1-minute style, a 10-year style and a Trending/Trading style (from my last article). All of that an more can be saved into your account as ChartStyles and then associated with StyleButtons for instance access.
-- Chip


