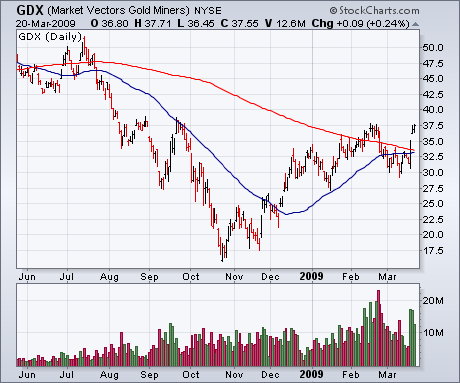
The Fed's midweek surprise announcement that it was buying Treasury bonds had a fairly predictable ripple effect through the various financial markets. Naturally, Treasury bond prices jumped and yields collapsed. The big drop in bond yields pushed the dollar sharply lower and commodities higher. As Arthur Hill described during the week, gold experienced an impressive upside reversal and may have reverted back to an inverse relationship to the dollar. One of the top stock groups on the week was precious metals. A month ago, I turned cautious on the short-term outlook for precious metals when the Market Vectors Gold Miners ETF (GDX) fell back below its 200-day moving average. Chart 1, however, shows the GDX closing well above that resistance line and on the verge of a new six-month high. That puts precious metal assets back in the fast lane. The main reason for the jump in gold and other commodities is the belief that a weaker dollar resulting from the Fed's printing of so much money will increase inflation pressures. One way to hedge against that possibility is to own some precious metal assets. Another way is to own some TIPS.

