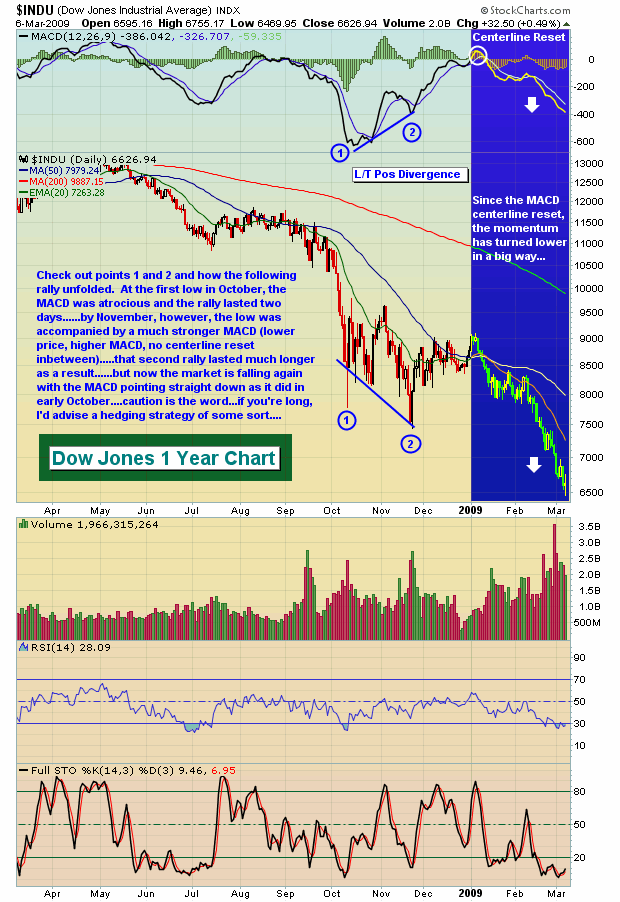
Significant market bottoms generally share many key characteristics. I like to see a spike in volume to get that last wave of selling in place. During this "panicked" phase, it's also important to see pessimism rise to a relative level where we can be fairly confident that a rally can last more than an hour or two. Obviously, oversold momentum oscillators like stochastics and RSI are in play at a bottom. My favorite momentum oscillator - the MACD - can provide clues as to the duration of any potential rally.
On the Dow Jones chart below, notice that the MACD is pointing straight down on the daily chart. It's unusual to see a long-term bottom form when momentum is so negative. So at this point, if the pessimism ramps up to a point where a bottom forms, I'd only be looking for a short-term rally to follow. In order to see a more sustainable rally ensue, I need to see this momentum slow and begin to reverse. That's where long-term positive divergences come into play. The market showed much more stability after the November lows and the positive divergence formed on the daily chart. Check out the Dow Jones chart below:
While I acknowledge that market bottoms can be carved out without extreme pessimism, this type of pessimism usually does form during emotional markets. I would certainly be much more confident about trading a rebound in the market if the pessimism reaches an extreme level first. On the S&P 500 chart below, I've highlighted recent market bottoms, the 5 day moving average of the equity only put call ratio at that time, and the subsequent gains realized off of the panic bottom. It's important to note that the average equity only put call ratio reading since the CBOE began providing the data in 2003 is .67. The average since September 1, 2008 is .79, much higher due to the increased fear overall. From these numbers, you can see that any move of the 5 day moving average above .90 should be respected. Here's the chart:
For free educational videos of the put call ratio and how to successfully incorporate them in your trading strategy, go to www.investedcentral.com/putcall.html.
Happy trading!


