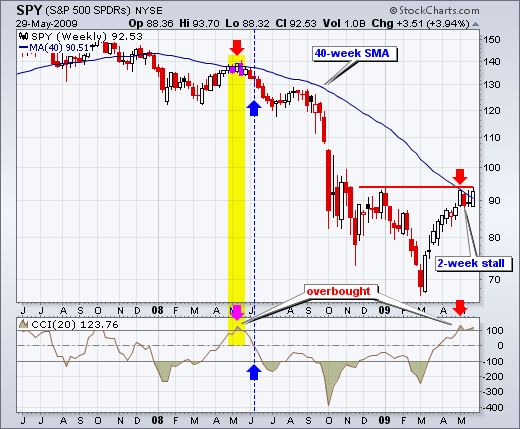
With a huge rally from early March to late May, the S&P 500 ETF (SPY) is trading just above its 40-week moving average and a key momentum oscillator is overbought. The 40-week moving average is the weekly equivalent to the 200-day moving average (40 weeks x 5 days = 200 days). Also notice that the ETF is meeting resistance from this key moving average for the second time in two years. SPY first failed at the 40-week moving average in May-June 2008. SPY hit this moving average in late April 2008 and hovered near the moving average for 4-5 weeks. The indicator window shows the 20-period Commodity Channel Index (CCI), which became overbought for the first time since April-May 2008. For the second time in two years, SPY is trading near its 40-week moving average and CCI is overbought. The 2008 decline got started when CCI moved below zero in early June (blue arrows). This is the CCI signal to watch for a downturn in momentum.
