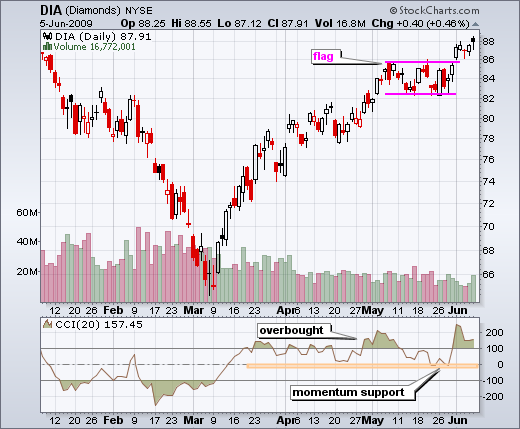
Even thought the Dow Diamonds (DIA) is overbought medium-term, the recent breakout is short-term bullish and this breakout is holding. On the daily chart, DIA broke above flag resistance with a surge on Monday. This move pushed CCI above 100 to turn momentum overbought. Even so, I would consider the trend both overbought and strong as long as CCI holds above 100. Notice how CCI bounced off the zero area in late May. Medium-term momentum should be considered bullish as long as CCI stays positive. 

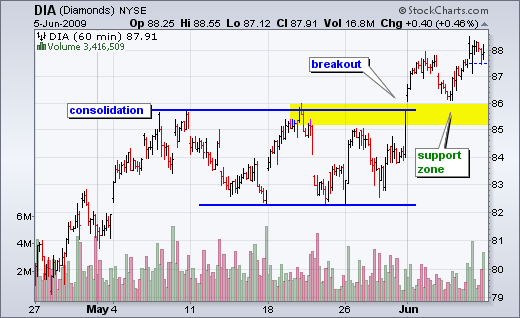
The second chart shows 60-minute candlesticks to focus on the recent breakout. This chart features a consolidation, a breakout and a support zone (yellow area). A key tenet of technical analysis is that broken resistance turns into support. In other words, a strong breakout should hold. Failure to hold this breakout and a move below the yellow support zone would be short-term bearish. As such, this is the first support area to watch for signs of a trend change.


