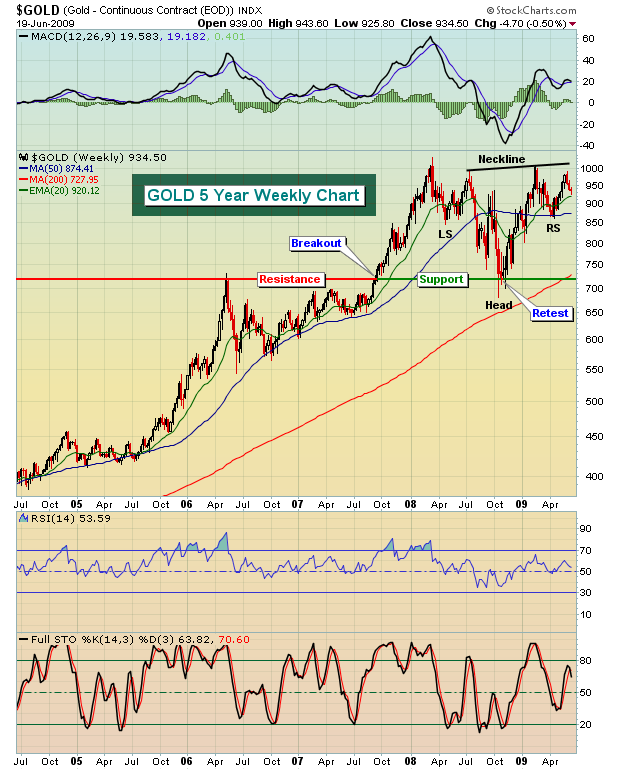
There are lots of questions in the market regarding possible inflation, deflation, and general market weakness. One way to hedge against all three is to play gold. Below is a long-term weekly chart that shows gold in a very bullish inverse head & shoulders continuation pattern. The current pattern is preceded by an uptrend, a requirement for an inverse head & shoulder pattern to be effective. While there are plenty of fundamental reasons to include gold in your portfolio, the technical reasons may be even stronger.
Check out the 5 year weekly chart on gold:
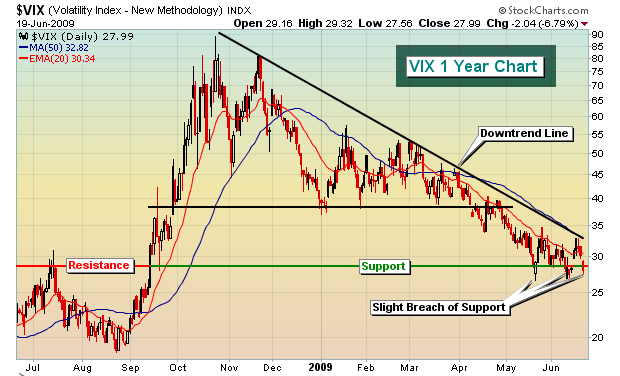
Watch for a breakout on gold above 1000, especially above 1025. The argument for a move higher grows stronger if equities weaken further or simply consolidate this summer. In my last article, I pointed out that the market appeared to be topping and I produced a video detailing the reasons. If you haven't seen the video, or you simply want to check out other videos that have been produced, click here (www.investedcentral.com/public/department57.cfm). There were several factors that influenced my call, including a VIX that had hit key long-term support. I believed the VIX would bounce off support and, in doing so, would send the major indices lower. Support at and around 28 on the VIX is quite strong as can be seen below:
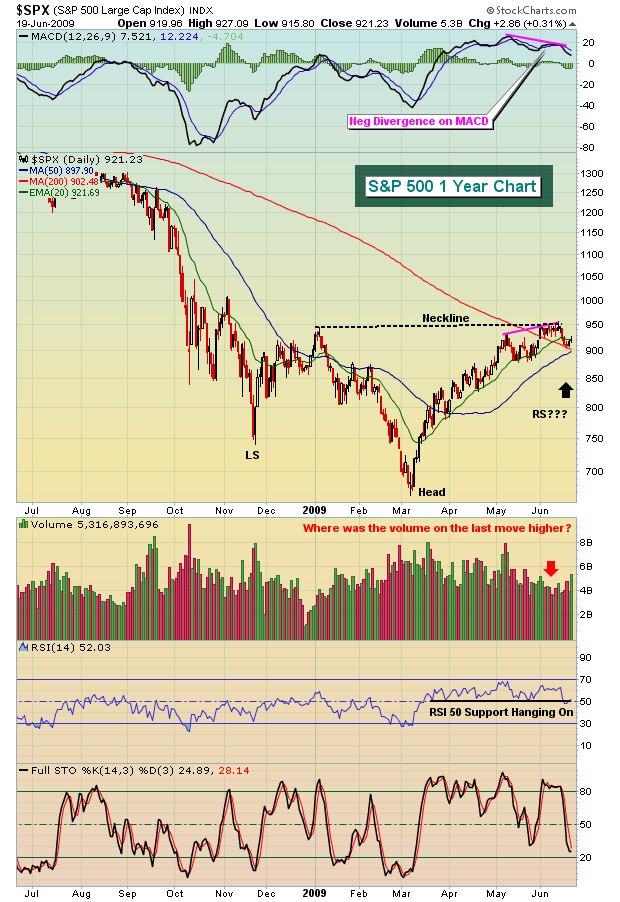
The primary trend in equities remains bullish in my view. I believe the current move lower is potentially establishing the right shoulder of a reverse head & shoulders bottoming pattern as shown below on the S&P 500 chart:
I'm expecting a test of the 50 day SMA, possibly slightly lower, before another leg higher. So, short-term I expect the market to be choppy to lower. I do, however, expect another rally to new highs in the not-too-distant future. Any further move to the downside will have to be evaluated as to volume, divergences, etc. in order to determine if the move down is something other than a corrective decline. An impulsive move to the downside would need to be respected.
Happy trading!


