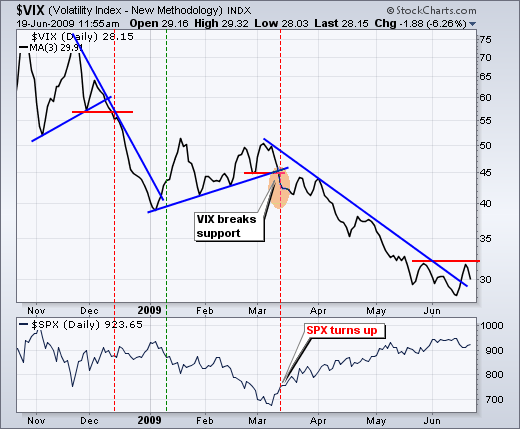
A downtrend in the S&P 500 Volatility Index ($VIX) underpins the current rally in the S&P 500. After all, decreasing fear gives way to confidence. The chart below shows the VIX as a 3-day SMA to smooth out daily fluctuations. The VIX broke support on 12 March and this coincided with the March surge in the S&P 500. The VIX continued to trend lower as the S&P 500 extended its advance. While the S&P 500 hit a new high for the move in June, the VIX recorded a new reaction low to keep pace. With the sharp decline early this week, the VIX surged off its June low and broke the March trendline. This is a warning sign, but not quite enough to call for a new uptrend in the VIX. Look for further strength above the late May high signal a trend reversal and increase in fear that would be bearish for stocks.


