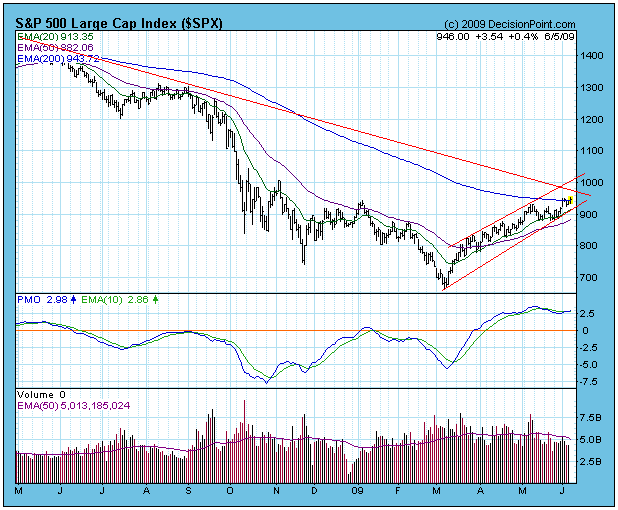
On the chart below we could attach a callout window to the rally that began in March and entitle it "Bull Market Rules Apply". Bull market rules generally mean that bullish setups will almost always resolve positively, and that bearish setups will usually fail to execute, because the market is being driven by a strong bullish bias. For example, at the early-May price top we had a perfect setup for a price reversal that could have declined into a nice correction. Many medium-term indicators were very overbought, and that condition needed to be cleared.
However, instead of correcting downward, prices moved sideways in a consolidation pattern, clearing the overbought condition without giving up any significant ground. Then at the end of the consolidation a strong breakout occurred. This breakout could have been a blowoff top, but, instead of immediately reversing downward, prices began to consolidate (so far for four days), erasing any hope the bears may have had for a decline.
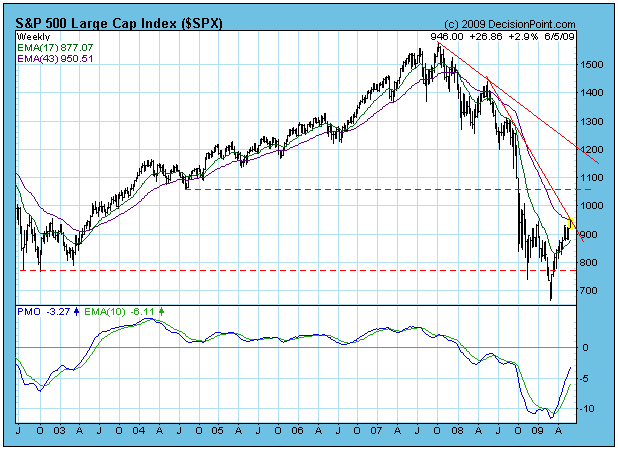
Now, as you can see, prices have hit resistance at the 200-EMA. Not only that, but there is a long-term declining tops line just ahead. This resistance is strong and significant, and a reasonable assumption is that prices will be turned back from it.
On the weekly-based S&P 500 chart below, the declining tops line is displayed in its entirety, and its significance is more easily grasped.
So what's next? If the underlying bullish market bias persists, then the resistance will be overcome; however, the rally has gone long and far enough that it could be time for it to end. I think it is too late to open new longs, and too early to go short. We have been on a buy signal since March 17 and are sitting on a nice gain, so we can comfortably sit tight and wait to see what happens.
Bottom Line: We have experienced a nice rally from the March lows, but the price index has encountered important, and presumably strong, resistance. The chart evidence make a compelling argument that the rally is finally over, but the market's positive behavior to date warns against getting too bearish too soon.


