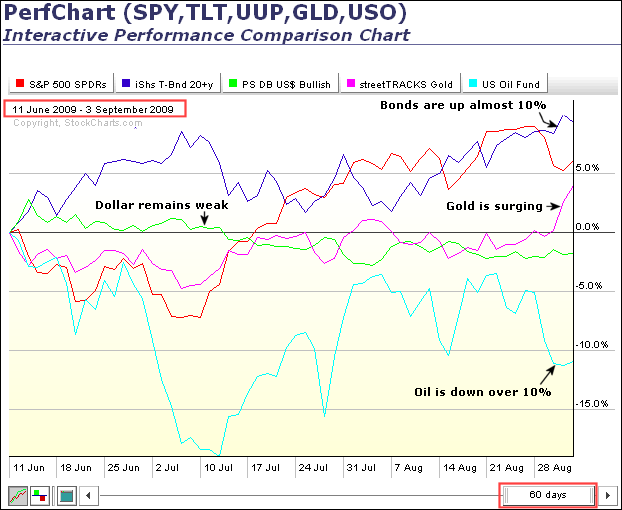
Intermarket analysis shows strength in bonds and gold, but weakness in the Dollar and oil. Strange days indeed. The Intermarket Perfchart below shows performance over the last sixty days, from June 11th to September 3rd. Relative strength in bonds is the first thing that jumps out. Performance for the 20+ Year Treasury ETF (TLT) has been positive the entire time (60 days). In contrast to bonds, oil is the weakest of the intermarket players. Except for a positive blip in early June, performance for the US Oil Fund ETF (light blue) has been negative since mid June. While bonds are up over 10%, oil is down over 10%. Could this be a sign of deflation? For one reason or another, money is clearly moving into bonds. It could be deflationary pressures, slower economic growth or a flight to safety. It is also interesting to note that oil moved lower even as the US Dollar moved lower. Oil usually benefits from weakness in the Dollar. The green line shows the Dollar Bullish ETF (UUP) working its way lower from mid June to early September. Weakness in the Dollar is, however, helping gold, which surged over the last few weeks (pink line).

