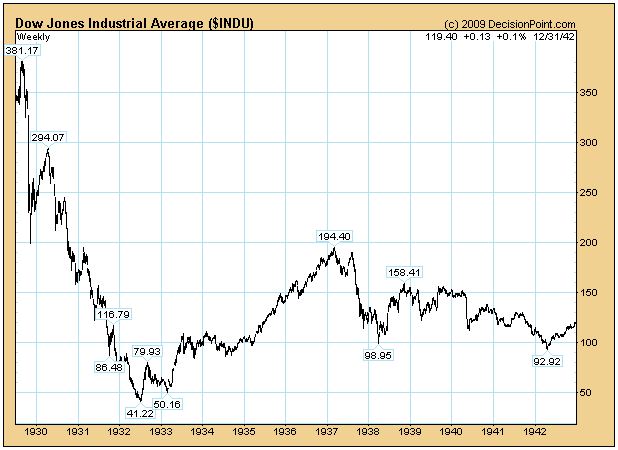
I continue to get mail from people who question how it is possible to be bullish in the face of the worst fundamentals since the Great Depression, so I thought it would be useful to look at a chart of the 1929 Crash and the decade that followed it.
Squeezed on the left side of the chart you can see the initial Crash and the rally that followed it into mid-1930. That was a bear market rally, and it advanced about 50% from the Crash low. While all our current signals are bullish, I still have no problem imagining our current rally ultimately resolving in this manner. The point, however, is that the big rally in 1930 occurred at a time that the fundamental problems had hardly been acknowledged, let alone solved.
After the final low in 1932 the market rallied for over four years and 300% during what has to be characterized as the depths of the Depression. I do not mean to assert that this is what I expect from our current situation, only to demonstrate what can happen and how fundamentals can often be at odds with price movement.
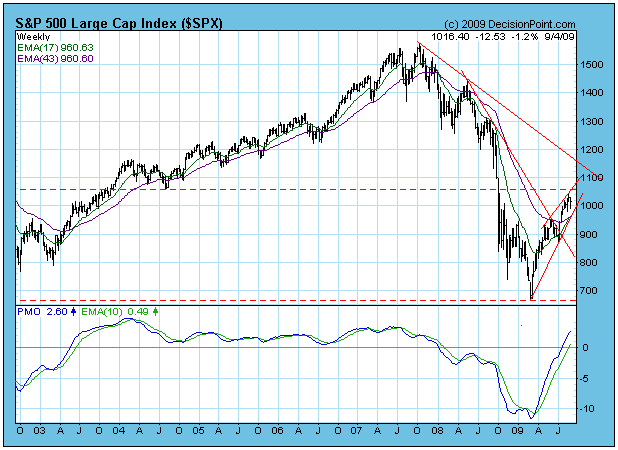
Moving back to the present, let's take a look at a weekly-based chart of the S&P 500. As of Friday's close, the 17-EMA crossed up through the 43-EMA by a thin, thin, thin margin of 0.03. This is the approximate equivalent of a 50/200-EMA crossover on the daily-based chart, and it confirms the long-term (months to years) buy signal we got on August 11.
What bothers me on this chart is the ascending wedge pattern, which looks more ominous from a weekly perspective than it does from a daily view. It is hard for me to imagine this wedge resolving any way but downward. I cannot picture in my mind a congruous price pattern that could result from an upside breakout. Once a correction is completed, more sensible possibilities could emerge. I guess this opinion falls under the heading of "gut feeling", but it comes from a person who has looked at a lot of charts for a lot of years.
Bottom Line: Medium-term indicators are still quite overbought, and a correction would be the best way to clear this condition. Is entirely possible that we have seen the top of the rally/bull market, but medium- and long-term signals are positive, so I think the worst case we should expect for now is a correction. Our medium-term timing model will switch to neutral from buy if the S&P 500 daily 20-EMA crosses down through the 50-EMA.


