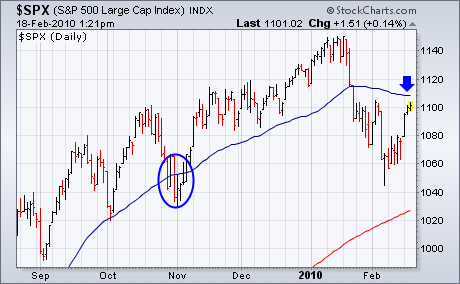
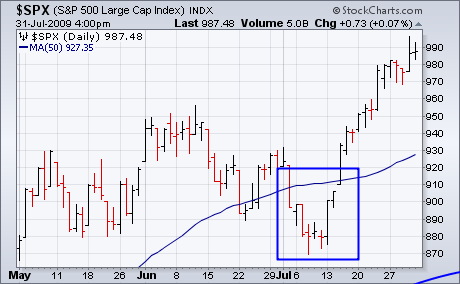
One of our readers recently pointed out that the blue 50-day moving average is declining for the first time since last March, and asked if that makes it more of a resistance barrier. The short answer is probably. Although most attention is paid to "crossings" above and below a moving average, the "direction" of the line itself is also important. Near the end of October, the SPX fell below its rising 50-day line briefly before moving back above it within a week (see circle). Last July, the SPX also fell below its 50-day line for eight days before turning back up again (see box in Chart 2). At that time, the 50-day line continued rising as well. Since mid-January of this year, however, the 50-day line has been dropping. That makes the recent price decline a bit more serious. For recent damage to be reversed, therefore, at least two things have to happen. First, the SPX needs to close back above the blue line. Secondly, the blue has to start rising again.


