ChartWatchers

TRANSPORTATION STOCKS LAGGING - MORE TURBULENCE AHEAD?

Tom Bowley

Tom Bowley

Chief Market Strategist, EarningsBeats.com

History is a valuable tool in the stock market as we witness cycles repeating themselves all the time.  Our major indices and the various sectors and industries rotate back and forth as our economy moves from strength to weakness and back to strength again.  Certain sectors perform better during strong economic times while others outperform as our economy stumbles.  I like to use this knowledge as the market makes its moves up and down to determine "staying power".  For instance, transportation stocks tend to lead the economy out of recession and it makes sense because as economic conditions improve, industries like the railroads are relied upon to ship more goods, etc.  So when charts relating to the transportation group begin moving up on a relative basis to the S&P 500, it generally will alert us to the probability that the underlying economy is strengthening and we should look for higher prices in the broader market to continue.  When transports underperform on a relative basis, however, it tells us to be a bit more cautious about the overall market.  Take a look at the chart below:
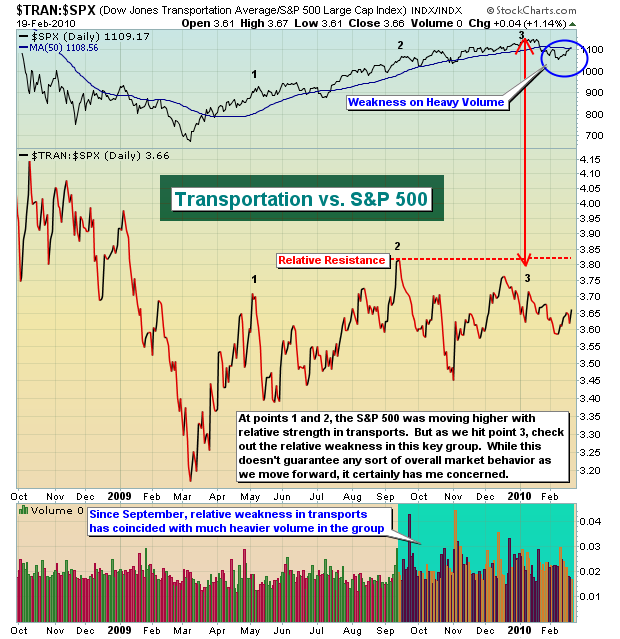
$TRAN vs. $SPX 2.20.10
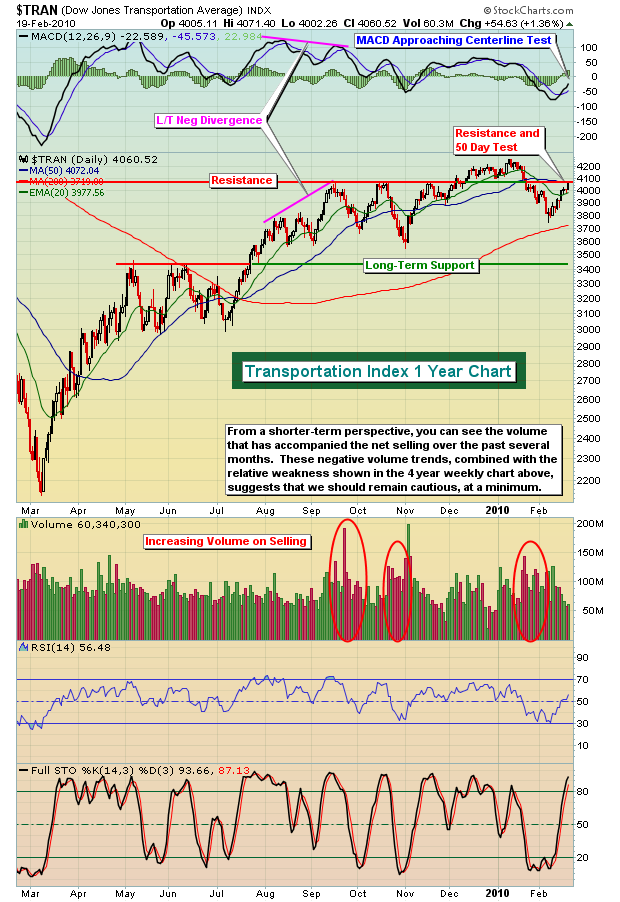
An obvious question to me is - why have transport stocks failed to break out to new relative highs since September 2009?  Furthermore, the transportation index made a triple top price breakout above the 4050 area in early December, failed to capitalize with much in the way of further gains, and then broke down badly in late January with very heavy volume.  Currently, transports are moving higher on much lesser volume and now are back to challenge that 4050 area and their 50 day SMA.  Check out the next two charts:
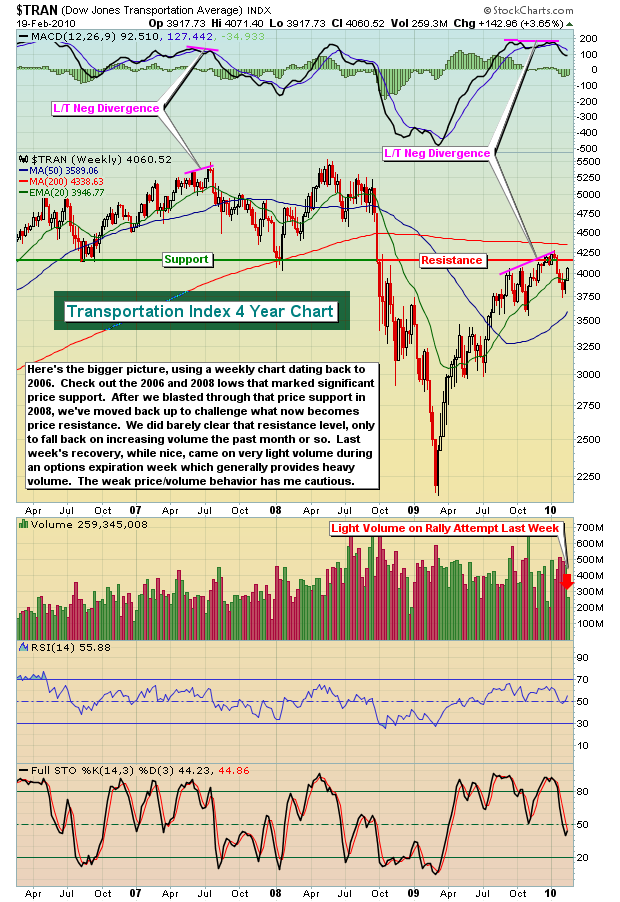
$TRAN 4 Yr Weekly 2.20.10
$TRAN 1 Yr Daily 2.20.10

The rally off the March 2009 lows shows a number of similarities to the 2003 rally off of the 2000-2002 bear market lows.  The current technical picture of transports and their relative action compared to the S&P 500 is very similar to what we saw back in 2003/2004 and provides further evidence that we could be setting up in a flag pattern in the S&P 500 that could last for several more weeks to months.  CLICK HERE to view this video.
 
The rally that we've witnessed the last two weeks is a bit stronger than I anticipated, but there certainly are more obstacles ahead for the bulls.  The actual short-term bottom recently should come as no surprise though.  In my last article, I discussed the short-term bullish implications of that high volume market reversal on Friday, February 5th.  In addition, the equity only put call ratio ("EOPCR") turned bullish early the next week.  If you missed Chip Anderson's chat with the Invested Central team, along with our members, you can still see it by CLICKING HERE.  I've also recorded a short version of setting up this indicator on StockCharts, while we also are providing the longer version with Chip's visit.  Both are worth watching.
 
Happy trading!


Tom Bowley
About the author: is the Chief Market Strategist of EarningsBeats.com, a company providing a research and educational platform for both investment professionals and individual investors. Tom writes a comprehensive Daily Market Report (DMR), providing guidance to EB.com members every day that the stock market is open. Tom has contributed technical expertise here at StockCharts.com since 2006 and has a fundamental background in public accounting as well, blending a unique skill set to approach the U.S. stock market. Learn More