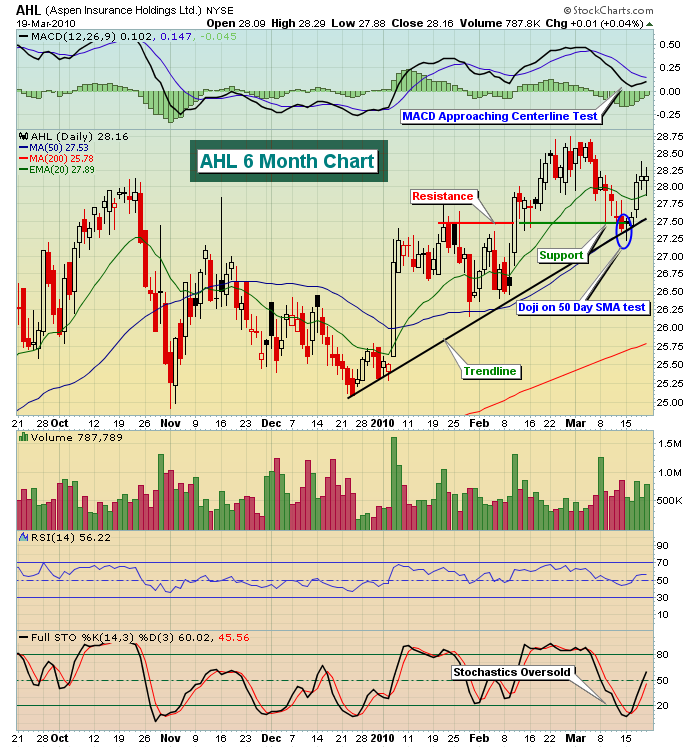
Candlesticks and candlestick patterns are the foundation to trading in my view. I use them on every charting timeframe, whether it's a one minute, hourly, daily, weekly or monthly chart. If you're a daytrader or swing trader, trading without the knowledge of reversing candlesticks is doing yourself a great disservice. While not every uptrend or downtrend ends with a reversing candlestick, most reversing candlesticks do end a trend if a prior trend is in place. The reversal may just be a temporary end to the trend, so you have to view these candlesticks in tandem with other technical indicators such as price support/resistance, trendlines, key moving averages, MACD divergences to determine the potential degree of any reversal. Combining these candlesticks with other technical indicators can be especially rewarding. Take a look at the following chart of Aspen Insurance Holdings (AHL):

AHL was our Chart of the Day for Tuesday, March 16th. I've circled the doji which would be an interesting candlestick all by itself. But when you combine it with a 50 day test, trendline test and price support test, it becomes even more meaningful. Also trading AHL, which at the time had RSI in the 40s and stochastics in the single digits, was a much better alternative than chasing stocks that had already advanced significantly and were sporting RSIs and stochastics in the 70s and 90s, respectively. AHL was also a fairly conservative trading prospect. Note that the 6 month trading range on AHL only spanned 3 points or so. So while it probably wasn't go to be a huge winner in terms of a percentage gain, neither was it likely to be a big loser. Given the extremely overbought market conditions last week, AHL represented a decent trading opportunity for the more conservative trader. A significant benefit to trading off of a reversing candlestick is that it provides you a pre-determined stop level. In the case of AHL, any move below $27.20 (the low the day the reversing candle printed) would have been a sign to exit. This is crucial as a trader because now you can clearly identify your risk. Roughly, there was $.30 per share risk in this trade. If you wanted to limit your risk to no more than $150, then you know to purchase no more than 500 shares (500 shares X $.30 = $150).
I realize not all traders are conservative, however, and many want to "swing for the fences" on occasion (or maybe more than "on occasion"). I search for those as well. You can check out two such candidates - KongZhong Corp (KONG) and Ford Motor (F) that were included as Charts of the Day on Thursday and Friday of this past week. F is included as a more aggressive stock in this example because it was included as a short candidate following Thursday's reversing candlestick. Note the 3.2% drop in F on Friday. CLICK HERE to view the videos we produced on our Thursday and Friday Charts of the Day on both KONG and F to gain a better understanding of the power of reversing candles.
By the way, every ETF that tracks the major indices printed reversing candlesticks on Friday. Given the recent uptrending market, this is something that shouldn't go unnoticed. The equity only put call ratio (EOPCR) indicator (my favorite sentiment indicator discussed in previous articles - check the archives) that marked the short-term bottom in early February was flashing a sell signal throughout last week as well. This is certainly indicative of a short-term top.
Whether you're an active daytrader, professional trader, portfolio manager or simply someone looking for a bit of supplemental income, candlesticks should be an integral part of your screening technique.
Happy trading!


