ChartWatchers

FINANCIALS FALL HEAVILY

John Murphy

John Murphy

Chief Technical Analyst, StockCharts.com

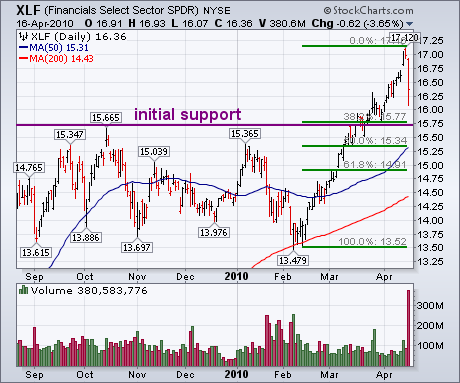
Financial stocks are considered to be leading indicators for the rest of the market. Over the last year, the group has led the market higher. Yesterday, they led it lower. The chart below shows the Financial SPDR (XLF) falling 3.6% on huge volume. The big volume is more serious than the price drop. With the group (and the market) having rallied two months without a pullback, one certaintly seems overdue. And it may have started yesterday. If this just a short-term pullback, the XLF should find support along its January high. The green lines show that would also be a 38% retracement of the February/April rally. The ability of the XLF to stay above that initial support level will help determine if this is just a short-term pullback or something more serious.

20100417002-sc

John Murphy
About the author: is the Chief Technical Analyst at StockCharts.com, a renowned author in the investment field and a former technical analyst for CNBC, and is considered the father of inter-market technical analysis. With over 40 years of market experience, he is the author of numerous popular works including “Technical Analysis of the Financial Markets” and “Trading with Intermarket Analysis”. Before joining StockCharts, John was the technical analyst for CNBC-TV for seven years on the popular show Tech Talk, and has authored three best-selling books on the subject: Technical Analysis of the Financial Markets, Trading with Intermarket Analysis and The Visual Investor. Learn More