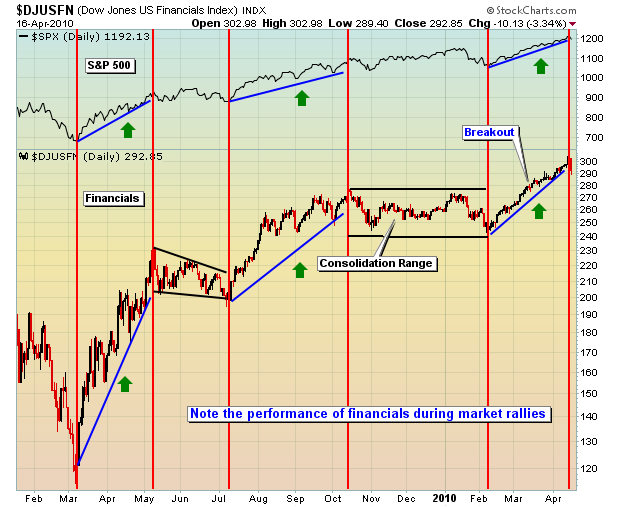
In my first article of 2010, I indicated that financials would need to lead on a relative basis in order for us to see strength in overall equity prices this year. Until late last week, financials have performed very well on a relative basis. Take a look visually at what I was referring to:

It's quite evident that the market is going only as far as the financial sector can take it. That leads to one very important question. Will the technical problems that surfaced this past week be resolved quickly in the upcoming week, or is the market finally ready to pause and collect its breath? While nothing is ever a guarantee in the stock market, my bet is that financials will underperform for at least a short period of time and that will stymie the market's advance. So what damage was caused?
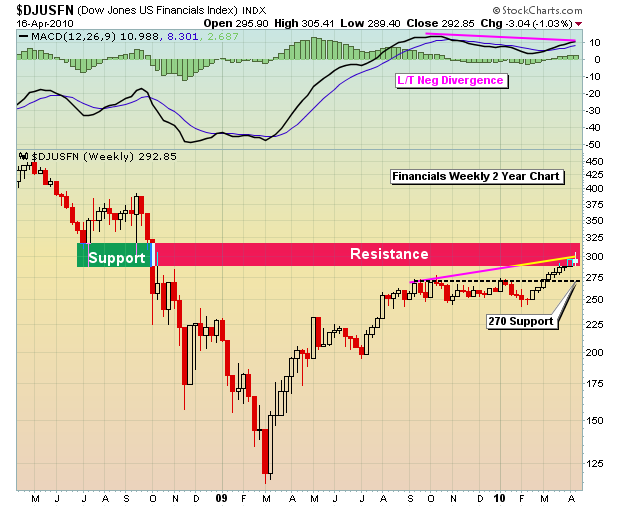
First, take a look at the weekly chart of the Dow Jones US Financial Index:

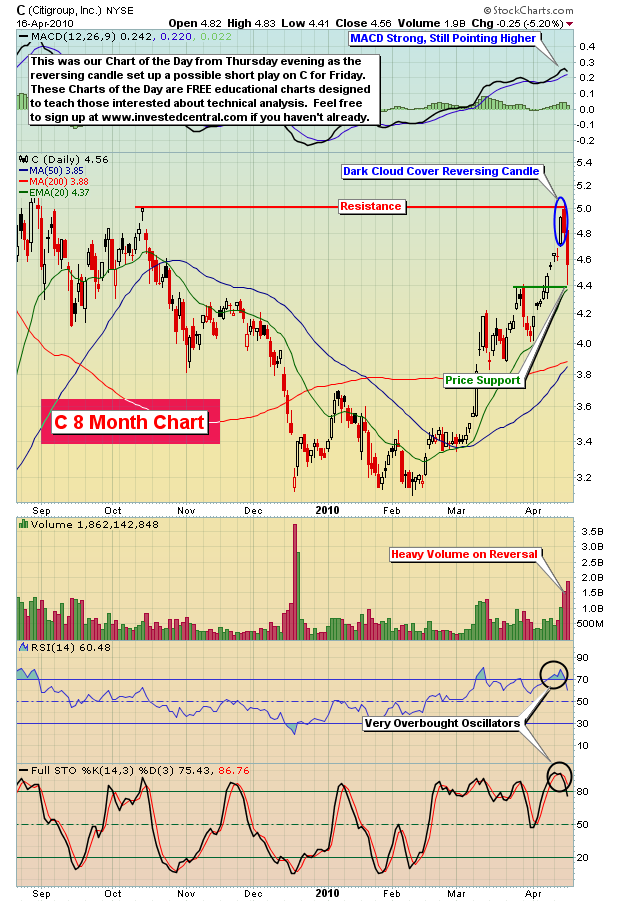
The long-term negative divergence that's present here raises intermediate-term concerns because such divergences on weekly charts tend to keep the bulls at bay for weeks, if not months. The heavy volume reversal in financials late this past week printed a dubious candlestick for the week. Our Chart of the Day on Friday morning featured a shorting opportunity on Citigroup (C). Check out this chart:

C immediately fell to the short-term price support that we mentioned near the $4.40 level. Now C rests in a trading range of $4.40-$5.00. Let's see which level falls first. Another short-term negative was the market's reaction on Friday to two solid reports. Bank of America (BAC) tripled profit expectations, yet that large financial finished the day -5.49%. General Electric (GE) also posted excellent results, but fell 2.7% on heavy volume and with a long-term negative divergence present on the daily chart.
Adding to the bears' fuel on Friday was the announcement that the SEC is alleging that Goldman Sachs (GS) defrauded investors out of $1 billion relating to mortgage investments. I'm not going into the details of the allegations, but help me with the math here. GS lost $23 per share on Friday, or $12 billion in market cap, because of $1 billion defrauding allegation? Is there more to it than what was provided in the initial news release or was this a complete overreaction on options expiration day? I guess we'll find out soon enough.
But here's the really ironic part of the GS story. GS has market making operations. Does anyone else see the irony in this being announced on options expiration Friday? Let me tell you that prior to Wednesday, the largest daily spread of equity calls traded vs. equity puts traded was 1.5 million contracts. After Intel (INTC) reported better-than-expected earnings on Tuesday, the spread of equity calls vs. equity puts skyrocketed to 2.0 million contracts on Wednesday. On Thursday, that spread was 1.8 million contracts. In other words, options traders have NEVER been so optimistic about the short-term market prospects and when everyone is buying up those calls, who is on the other side of the trade? Well, it's one of the responsibilities of the market maker - to provide liquidity in the marketplace. My proprietary relative complacency ratio hit 29% by Thursday's close. This is a useful sentiment indicator based on equity options trading and it marked the second consecutive day over 25%, which are the only two days it's ever been that high. Relative complacency generally marks tops. I've never seen the market print extreme readings like the ones on Wednesday and Thursday. So now let's discuss the timing of the SEC's Friday announcement. While GS likely stands to be slapped on the wrist at some point in the future for these alleged violations, I can only imagine how much the timing of the SEC's announcement cost all those call buyers on Wednesday and Thursday and helped turn profits at market making units like Goldman Sachs'. Let me just guess that it's more than $1 billion and leave it at that. I'm calling it the 2010 financial bailout, as if they needed another.
Ok, enough of my rant and back to the technicals. Unless the bulls can show even more resilience and print a new high on financials, we'd look at the action this past week as a topping candle. That sets up solid risk/reward shorting strategies in this space. If financials break to new highs, a small loss is taken. But if this truly does mark an intermediate-term top, an entry into the juiced ETF that tracks financials (SKF) wouldn't be a horrible strategy. CLICK HERE for our Chart of the Day for Monday, April 19th for more details on how to approach this potential trade.
Finally, I'm excited to announce that Invested Central will be hosting our first monthly event of our just announced Online Trader Series on Tuesday, April 20th at 4:30pm EST, which will cover trading strategies of juiced ETFs in general. If you trade juiced (or leveraged) ETFs, there are strategies to maximize profits that are critical and we'll discuss them in detail. CLICK HERE if you're interested in learning more.


