Hello Fellow ChartWatchers!
There is a TON of great stuff happening at StockCharts.com right now. First off, I want to make sure that everyone is aware that our SPRING SPECIAL is going on right now. Subscribe or extend your account for 12 months and we'll give you 2 additional months for free! (Subscribe of extend by 6 months and we'll give you 1 month for free.) But please do not delay because unlike previous specials, this one will only last for ONE WEEK! That means that you have to act before May 8th or you'll miss out. Why not click here right now to take advantage of this fleeting offer? Go ahead... We'll wait.
Are you back? Good! Now for the bigger news...
CATCHING AN IMPULSE
This week marks the debut of Dr. Alexander Elder in our ChartWatchers newsletter. Dr. Elder's books are legendary - I honestly hope everyone has read at least one or two of them. They can make anyone a better investor almost instantly. I am thrilled to have him contributing to StockCharts.com now.
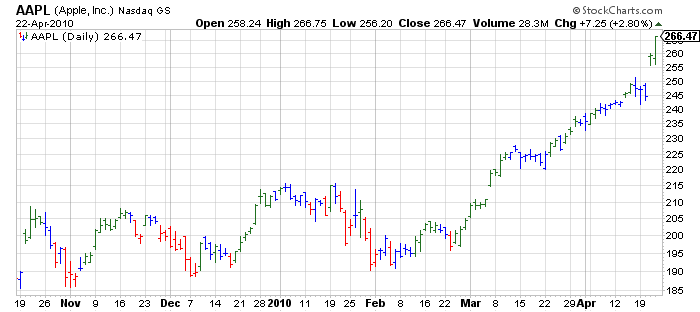
Dr. Elder's first contribution was to allow us to add his "Impulse System" of red, blue and green bars to our SharpCharts. Here's an example of what a chart with "Elder's Impulse System" looks like:
To create one of these charts, just select "Elder's Impulse System" from the "Type" dropdown on the SharpCharts page (or just click on the chart above to see an example). We've also created a new ChartSchool article that explains exactly what the colors mean and how they are arrived at.
When Dr. Elder saw his system on our site, he sent the following reaction: "It is a pleasure to see my Impulse System charts on the web for the first time!" Both he and I hope that it can help ChartWatchers everywhere.
INTRO: HOW I MANAGED MY PICK
Today Dr. Elder is also joining us as a columnist. He and Kerry Lovvom (a trader profiled in the book "Entries and Exits") currently run a website called SpikeTrade.com - a community of experienced stock traders. Each weekend, he writes a column called "How I Managed My Pick" that is a review of a trade that he entered and exited during the previous week. The column's goal is to educate people based on lessons of real-world experience. I think all ChartWatchers can benefit from Dr. Elder's articles. The article below was written on the first weekend in April. Watch for more current offerings in future newsletters. - Chip
A RACE BETWEEN A TURTLE AND HARES - ALEX ELDER
I did not expect to choose a Gold pick this week.
I expected a difficult week ahead, with many crosscurrents. Also, Inna, my manager, was taking two days off, and I knew I would have to spend a lot of time in the office, distracted from the screen. I kept looking at attractive shorts and longs, but in the end decided to go with what I thought was a defensive pick - a gold stock, AUY, picked by Colin B. one of our traders here at SpikeTrade.com.
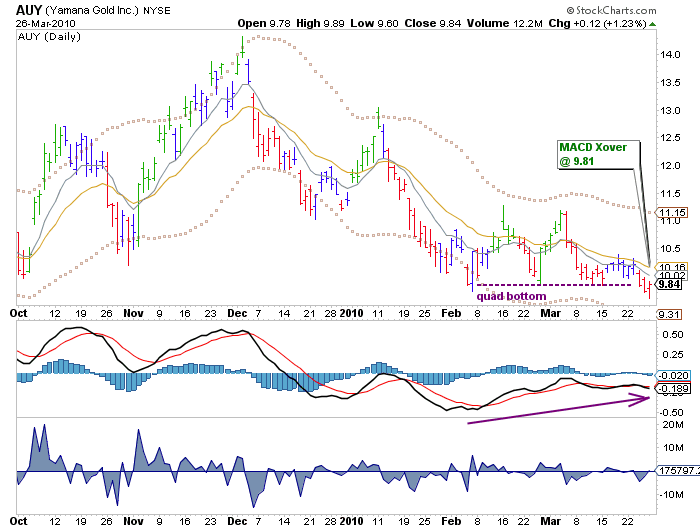
Here is the chart of AUY at the start of the week:
This daily chart shows a quad bottom. The three rightmost bars are Red. I love these false downside breakouts. The purple arrow indicates a potential bullish MACD divergence, and the text in the box reminds me that the Impulse system will go off Red if on Monday AUY trades at or above 9.81.
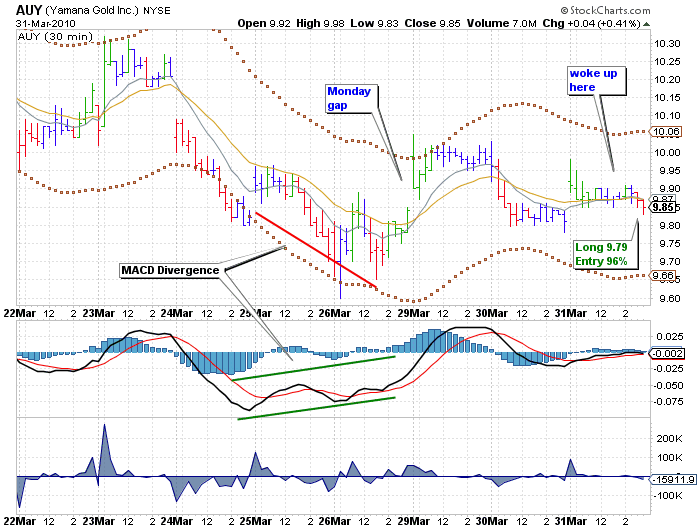
On Monday, AUY exploded on a gap, making me think I missed the boat, but on Tuesday it began to sag. As I lifted my head from Inna's work in late afternoon, I noticed that AUY had touched 9.80. I figured it would want to poke its toe a little lower and placed an order to buy at 9.79.
I usually do not discuss my trade sizing in these reports, but will do it now because it shows something useful about risk management. On Sunday, facing a busy week, I decided to risk only $500 on this trade. My initial plan was to enter at 9.85 with a stop at 9.61, risking 24 cents per share, allowing me to buy 2,000 shares.
I call this the Iron Triangle of risk control: you know you maximum risk, you know your risk per share, you divide A by B to get the permitted number of shares.
On Tuesday, buying at 9.79 with the same stop, my risk per share was only 18 cents. Dividing $500 total permitted risk by 18 cents allowed me to bump up the size of my trade to 3,000 shares. I placed an order with eTrade which allows me trade unlimited size for $7.99. My entry grade was 96%, meaning I just about caught the low of the day.
On Wednesday AUY rallied, then sagged, but kept above my entry level. I am a great believer in holding out for a good buy, and it paid off here.
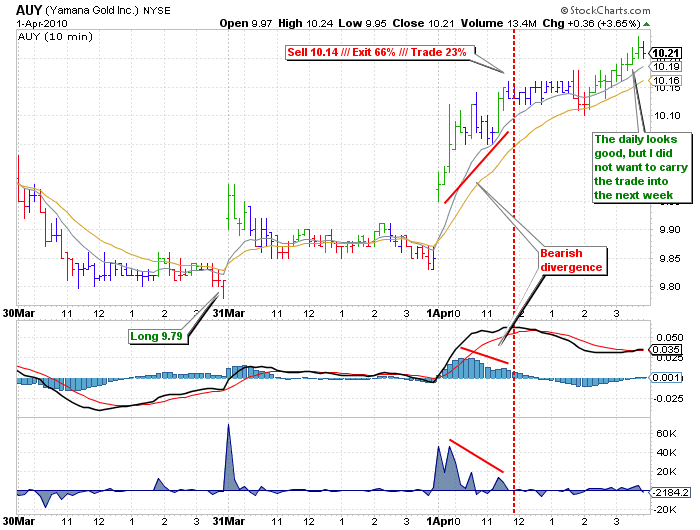
On Thursday, the last day of this short week, AUY rallied with great conviction. I seriously considered making it a longer-term trade, but caution prevailed; I prefer not to carry SpikeTrade picks like this one over the weekend. With Inna back in the office and me being able to concentrate on the screen, I was watching the intraday charts. When I saw a bearish divergence on the intraday chart, I took profits at 10.14. The gain was $1,050.
The lesson of this trade is that in a market driven by heavy crosscurrents a cautious defensive pick may well be the best solution!
All the best,
Alex

