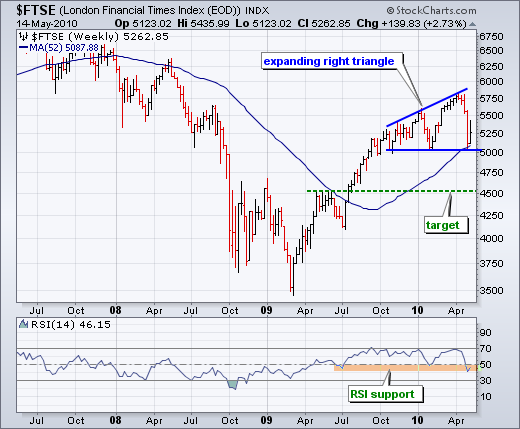
The London FTSE ($FTSE) has an expanding right triangle working over the last 7-8 months. These are akin to broadening formations, which are also bearish reversal patterns. After an advance from 3500 in March-09 to 5250 in October-09, the index moved into a volatile consolidation period. Notice the higher highs and relatively equal lows. It was a volatility and uncertain period. The pattern would be confirmed with a break below support around 5000. Such a move would also break the 52-week moving average for the first time since July 2009. Upon a confirmation break, the downside target would be the next support level around 4500, or another 10% lower. The indicator window shows RSI hitting the 40-50 support zone for the third time in a year. Momentum remains bullish as long as RSI holds this zone. A break below 40 would turn momentum bearish and could be used to confirm a support break at 5000.
 Click this image for details
 Click this image for details

About the author:
Arthur Hill, CMT, is the Chief Technical Strategist at TrendInvestorPro.com. Focusing predominantly on US equities and ETFs, his systematic approach of identifying trend, finding signals within the trend, and setting key price levels has made him an esteemed market technician. Arthur has written articles for numerous financial publications including Barrons and Stocks & Commodities Magazine. In addition to his Chartered Market Technician (CMT) designation, he holds an MBA from the Cass Business School at City University in London.
Learn More


